4. Features
Once the user selects the environment, it will be redirected to the homepage as shown below:
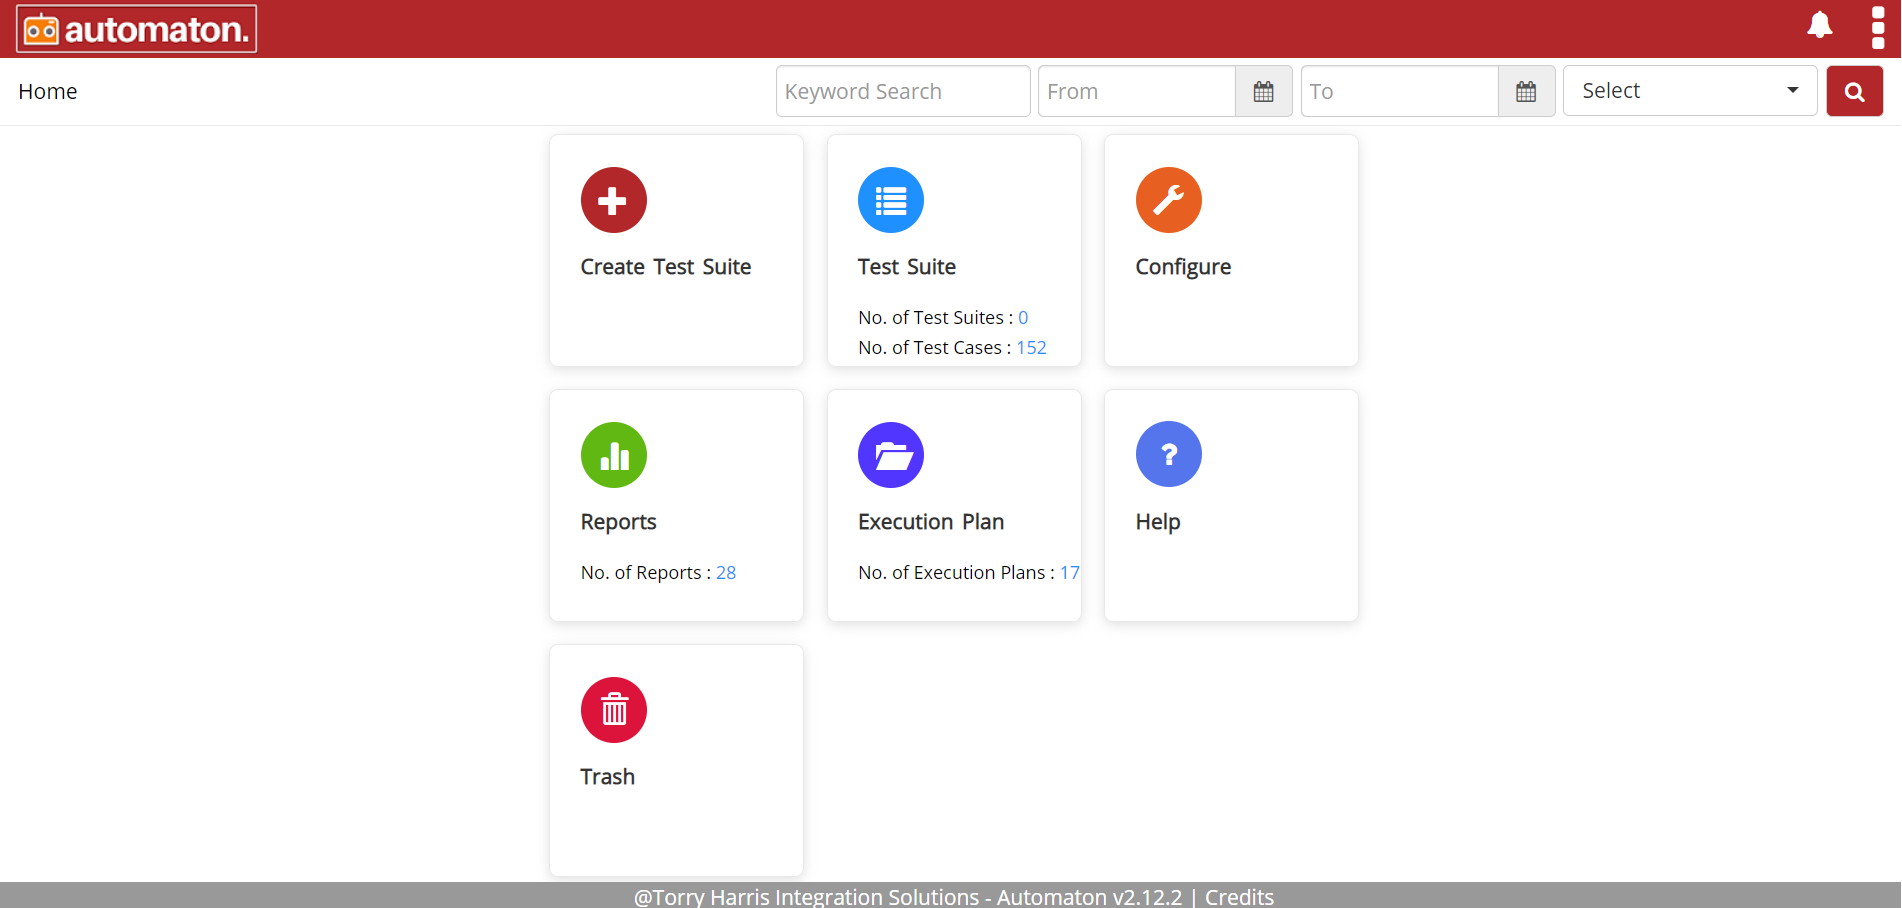
Fig. 4.1 Homepage
The search feature helps the user to find previously created Test cases, Test suites, and Reports.
Users can narrow their search by entering a keyword into the keyword search textbox.
It is recommended to populate this field with relevant information so that locating the test case/test suite through search will be quicker and easier.
It is also important to use relevant naming for your test suites and test cases to make keyword search better.
Users can also filter the search by setting the time range by giving From and To date.
Users can also select a type from the Select drop-down field and click the search icon ![]() to display the result as shown below:
to display the result as shown below:
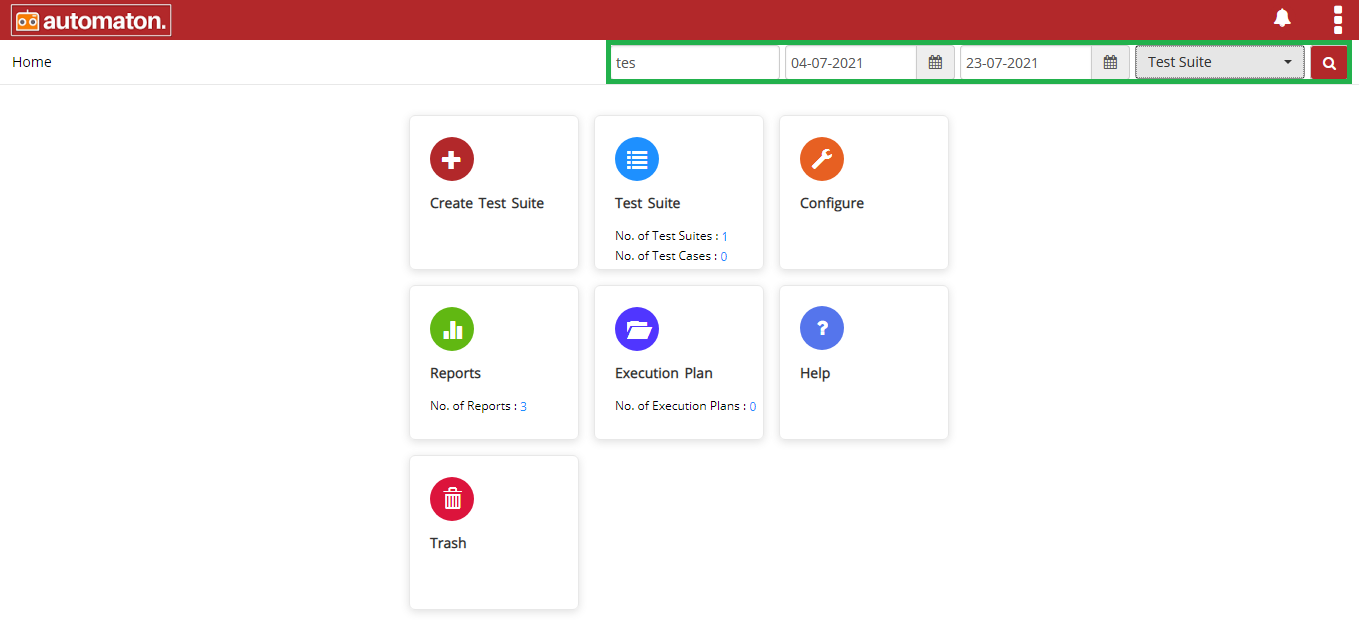
Fig. 4.2 Search
The homepage has the following sessions:
4.1. Create Test Suite
Fig. 4.3 Create Test Suite Icon
The above shown icon is to create test suites by providing name and selecting anyone among API, Database( supports databases like MariaDB, MySQL, Oracle, MongoDB), Log, Mobile test suites.
4.2. Test Suite
Fig. 4.4 Test Suite
Click the Test Suite icon to view the test cases, create a new test suite, or access the already created test suite. It will also display the total number of test suites and test cases. Click the plus icon|image4a| in the menu to create the test suite as shown below:
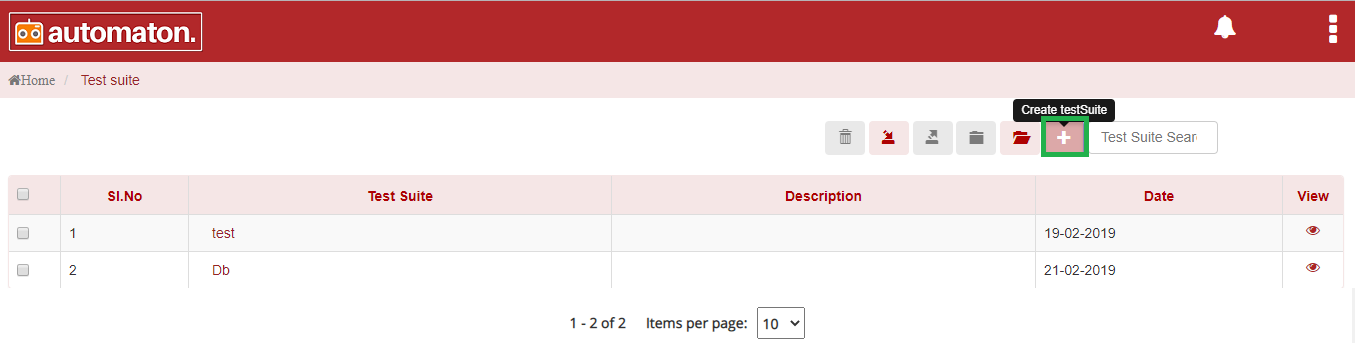
Fig. 4.5 Create Test Suite
It is important to give a descriptive name for your test suite. A descriptive name ensures easy access to your test suite through a keyword search or random browsing. Any user can locate your Test Suite with related phrases through search if the name is self-explanatory and contains common keywords. If the Test Suite name is not enriched with relevant keywords, locating the test suite becomes harder.
4.3. Configure
Fig. 4.6 Configure
Click the Configure tile navigates to Configure page as shown below:
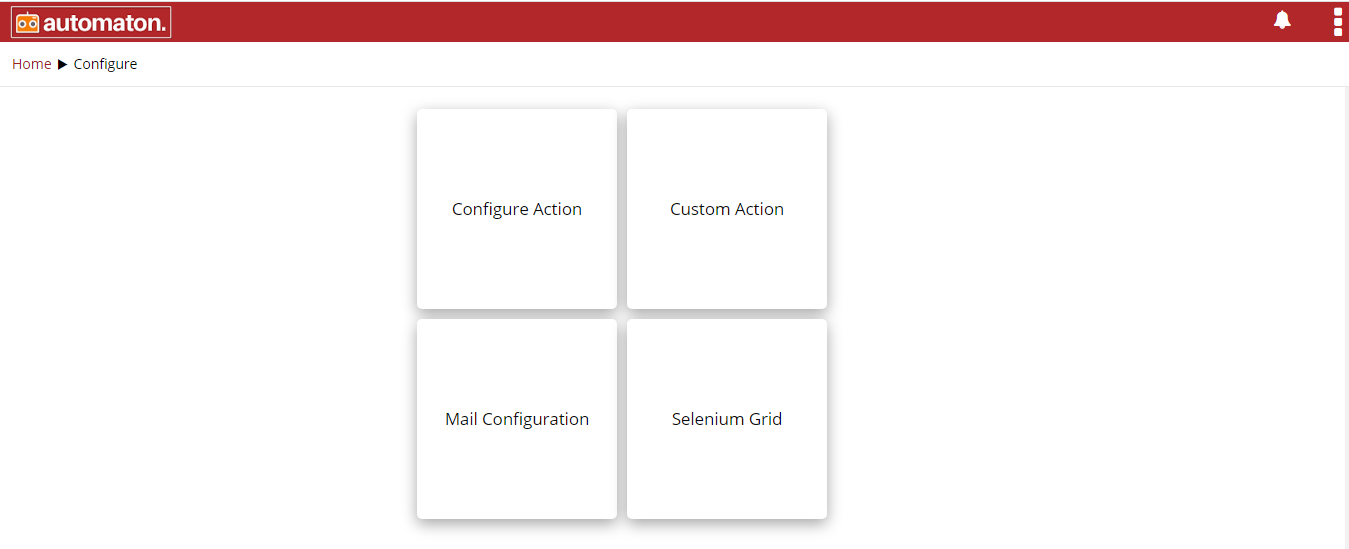
Fig. 4.7 Configure Page
- Configure Action
This is to build a new Action for corresponding elements like Start, Web, API, Process, Decision, Stop.
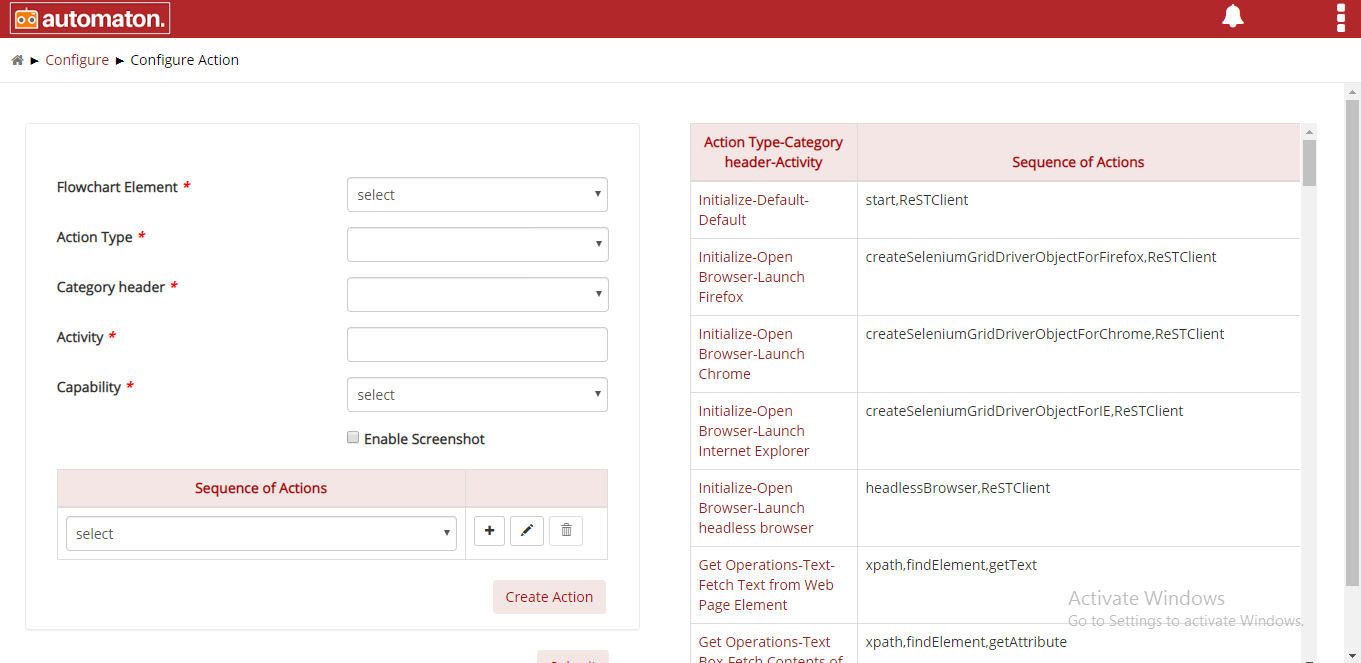
Fig. 4.8 Configure Action
2. Custom Action Custom Action is built to reuse the test cases when required. Here, users can customise the Automaton with custom actions that suit their needs. Thus, it saves time. Steps to Create and use Custom Action
- Create a Custom Action
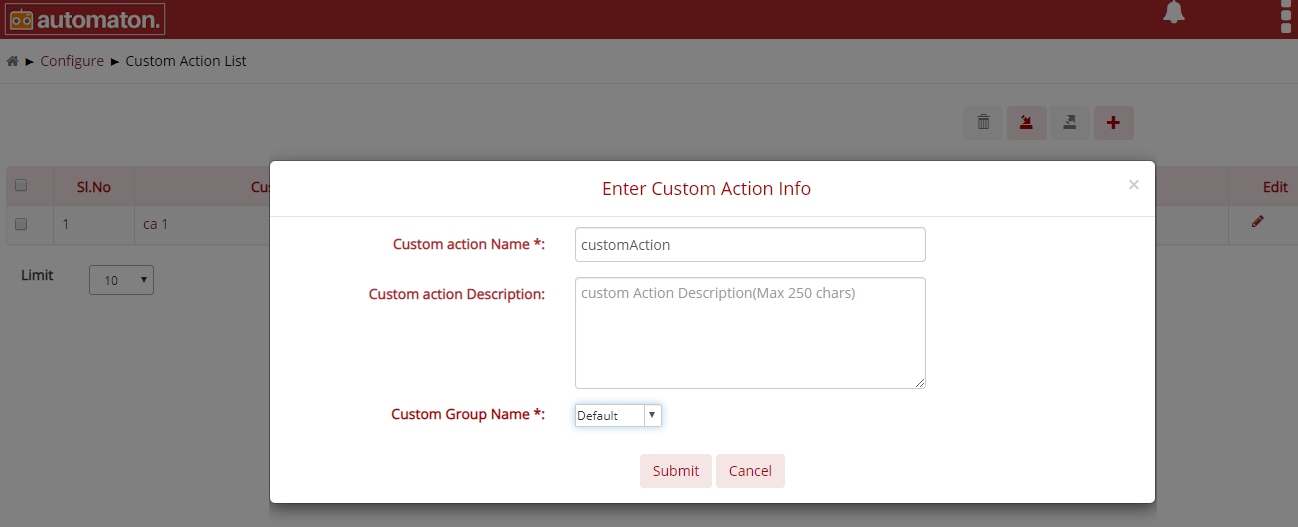
Fig. 4.9 Create Custom Action Page
Custom action Name: Specifies the name of Custom Action. Ensure that you are using relevant keywords. .. Note:: Custom Action Name is a mandatory field and should not exceed fifty characters. ..
Custom action Description: It is an optional field, but it is recommended to populate this field with relevant information and supporting keywords so that locating your test suite through a search will be quicker.
Custom Group Name: Specify which group Custom Action relay on.
Click the Submit button, the page will be redirected to the Custom Action page as shown below:
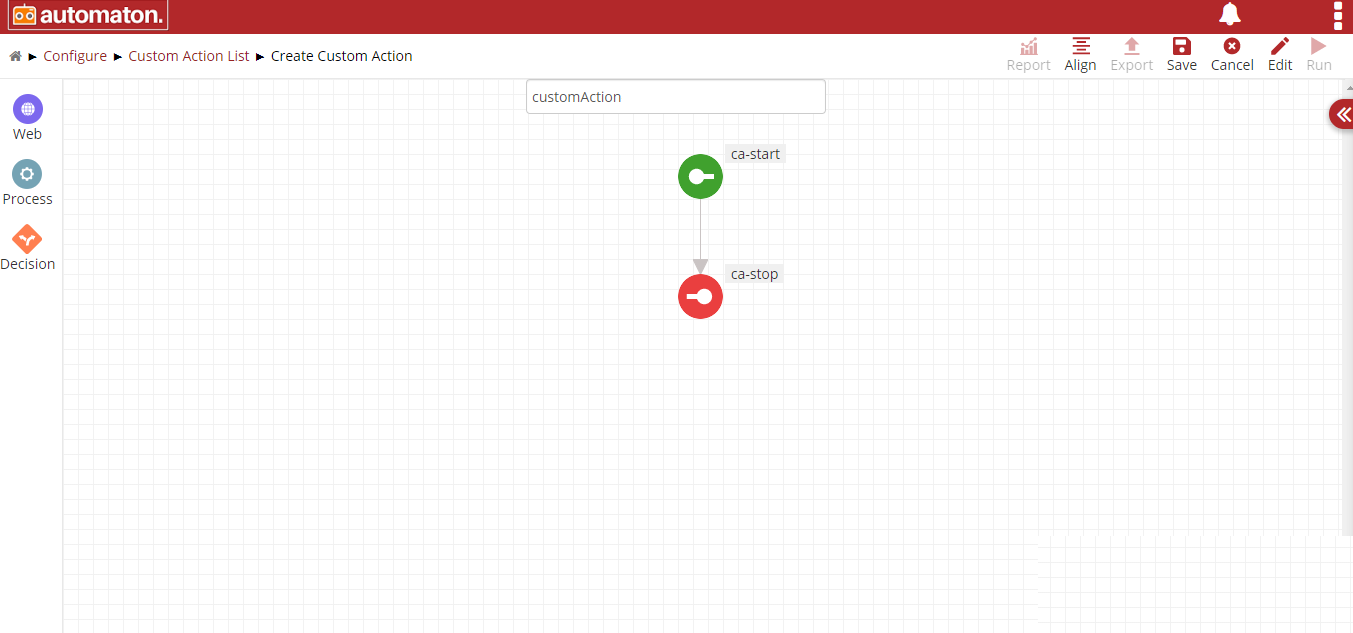
Fig. 4.10 Custom Action Page
- Both elements in the above figure are called “custom action nodes,” which help a user connect web, process, and decision elements. You can insert ca-start by hovering over the custom action node.
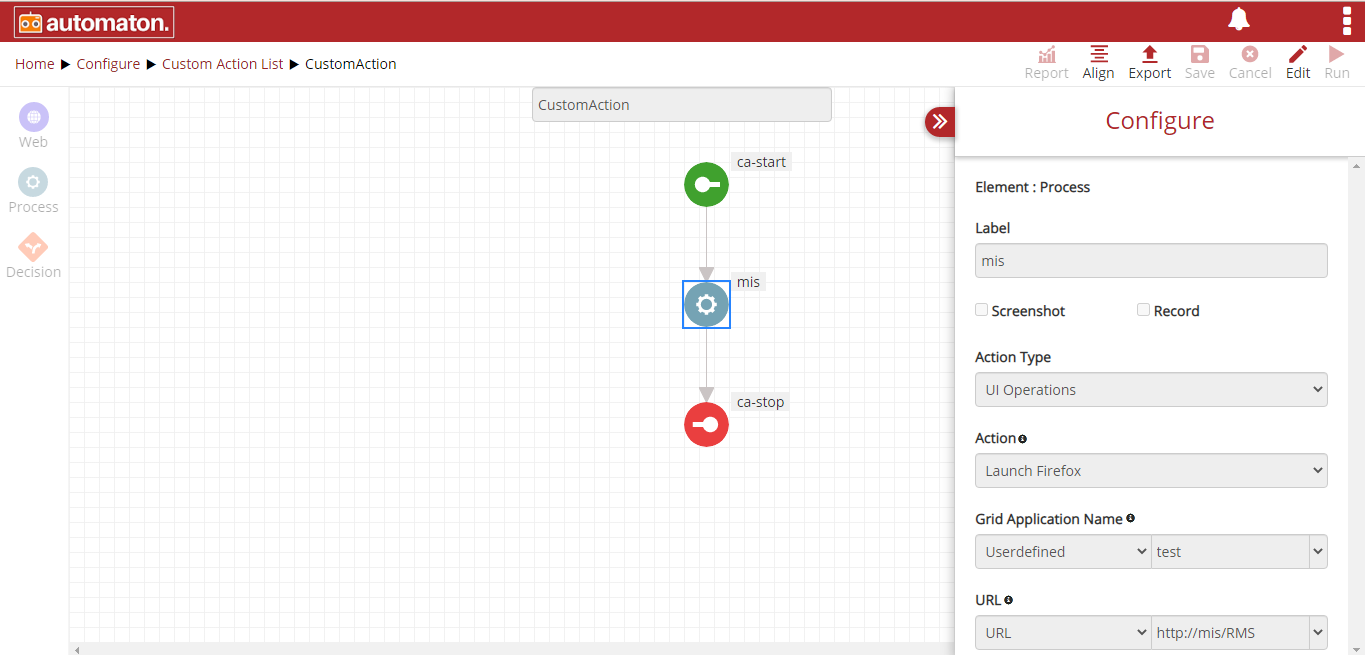
Fig. 4.11 Custom Action Page
The above figure shows creating Custom Action. To save Custom Action, click on Save button and Cancel to cancel the Custom Action created.
- Use Custom Action in Test Case
If a user needs a custom action in a test case, select the process element and add ‘Custom’ as Action Type and select the corresponding custom action created in Custom Group Name as shown below:
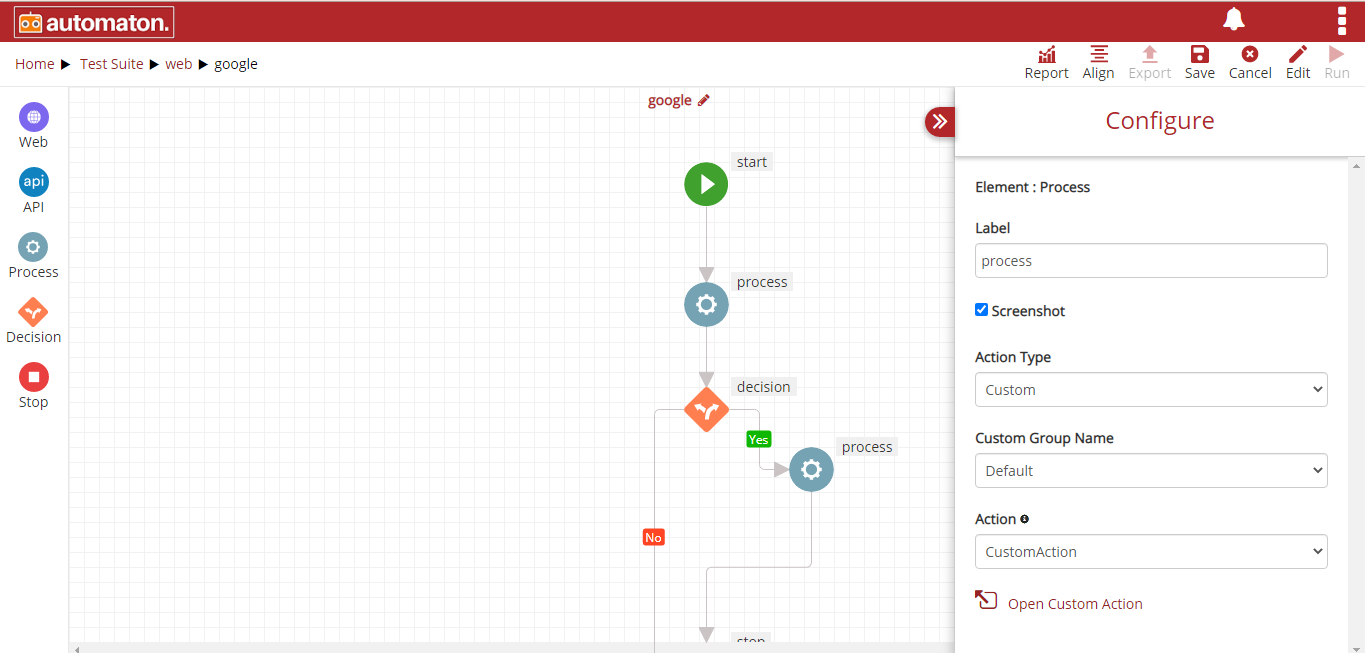
Fig. 4.12 Configure Custom Action
Once the Action Type and Custom Group Name are selected, then all the created custom actions will display in the Action field. Users can select the required custom action. Click on the Open Custom Action to view the custom action flow as shown below:
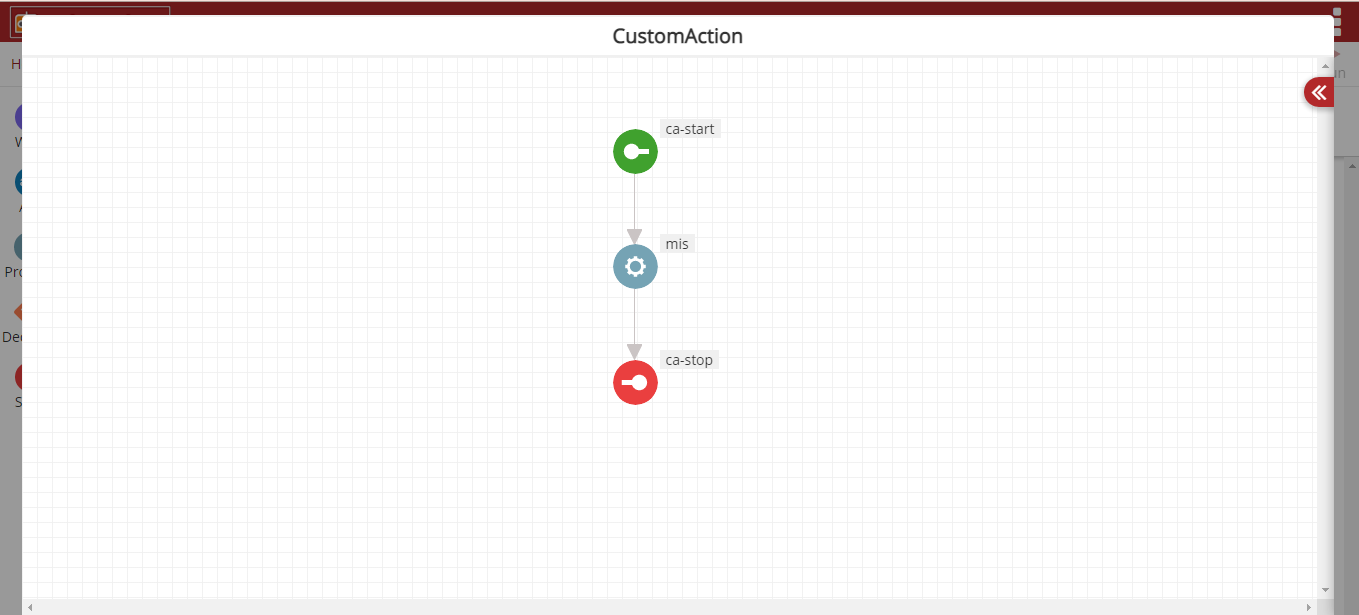
Fig. 4.13 Custom Action Flow
- Here users need to update the custom action like Step ID accordingly.
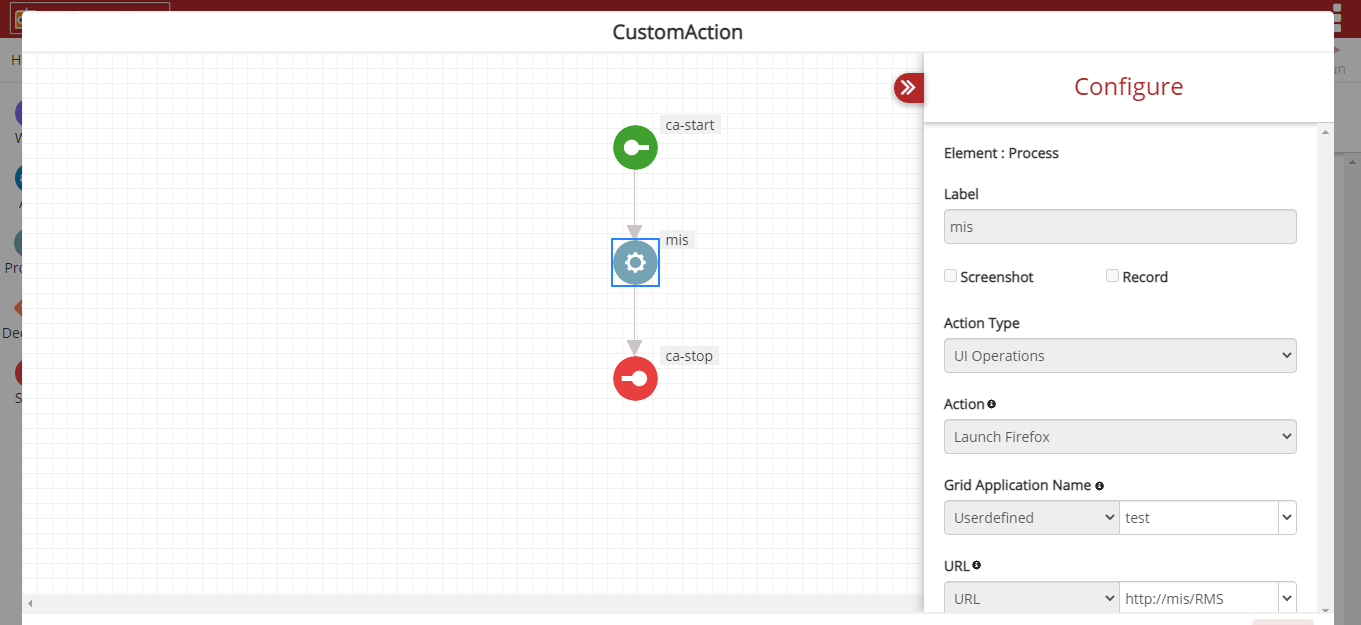
Fig. 4.14 Updating Custom Action
- Once the user is completed with test case creation, click Save > Run and a report will be generated.
Similarly, users can also use database custom action in the test case steps are as follows:
- Create a database Custom Action. For instance, here we using a Custom Action named db custom action. This custom action is intended to query a table and fetch the last_name from the record and map it.
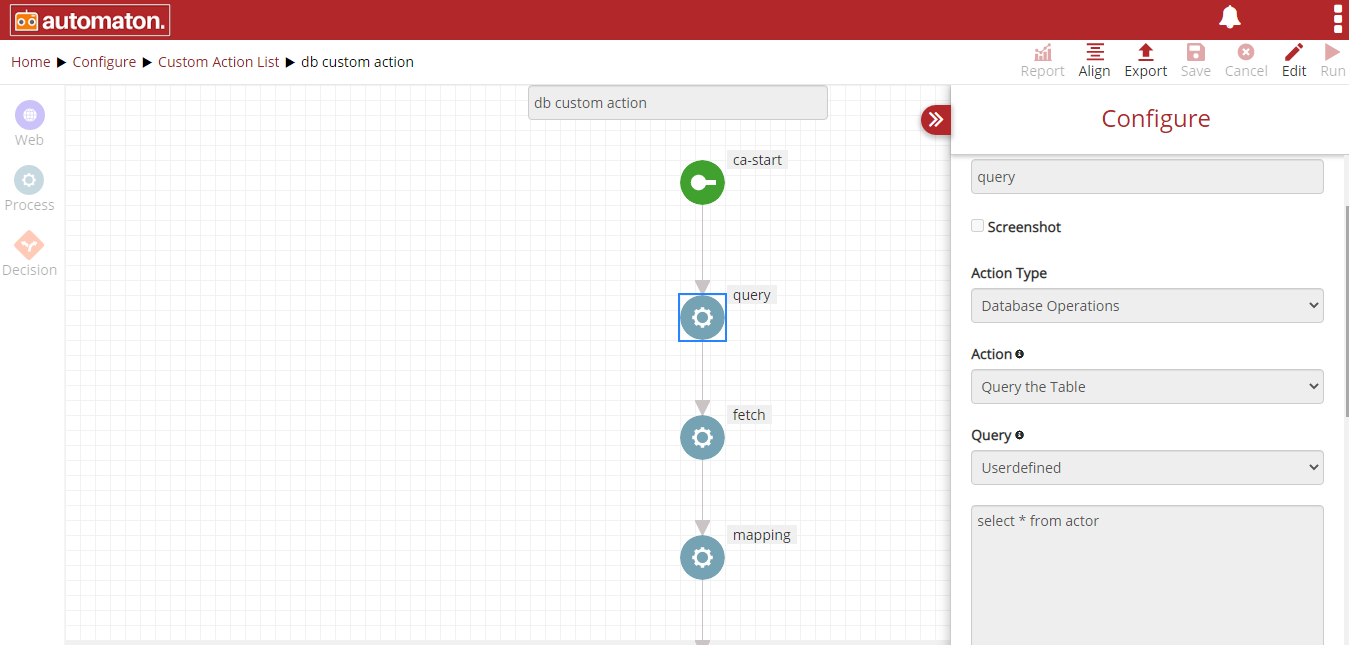
Fig. 4.15 Databse_Custom_Action
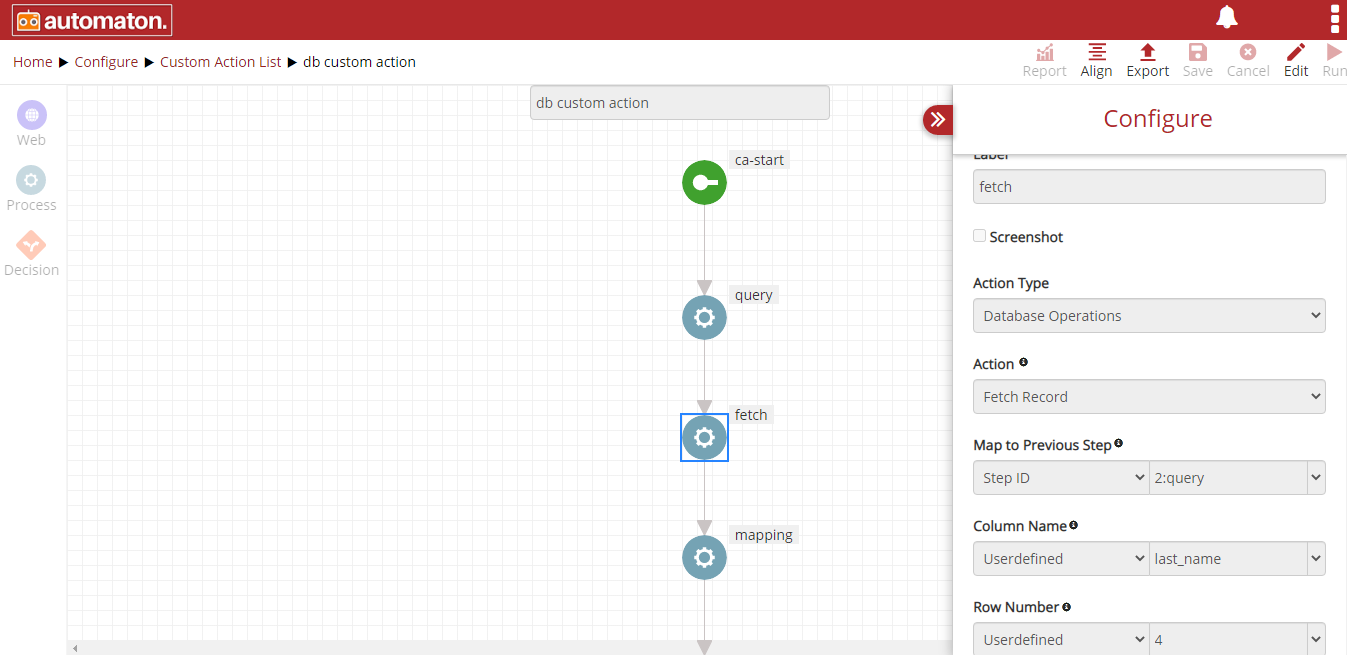
Fig. 4.16 Database Custom Action to Fetch Record
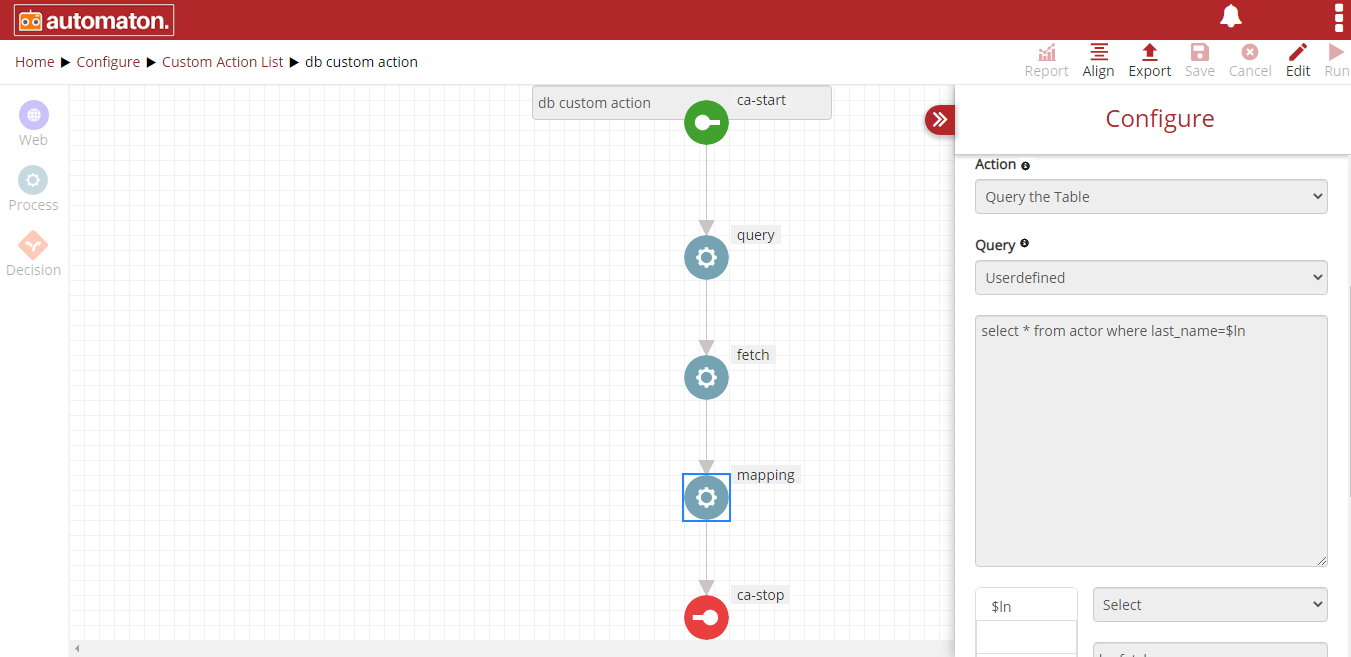
Fig. 4.17 Database Custom Action to Map
- Using database Custom Action in Test Case
- Create a database test case, db new from Test suite.
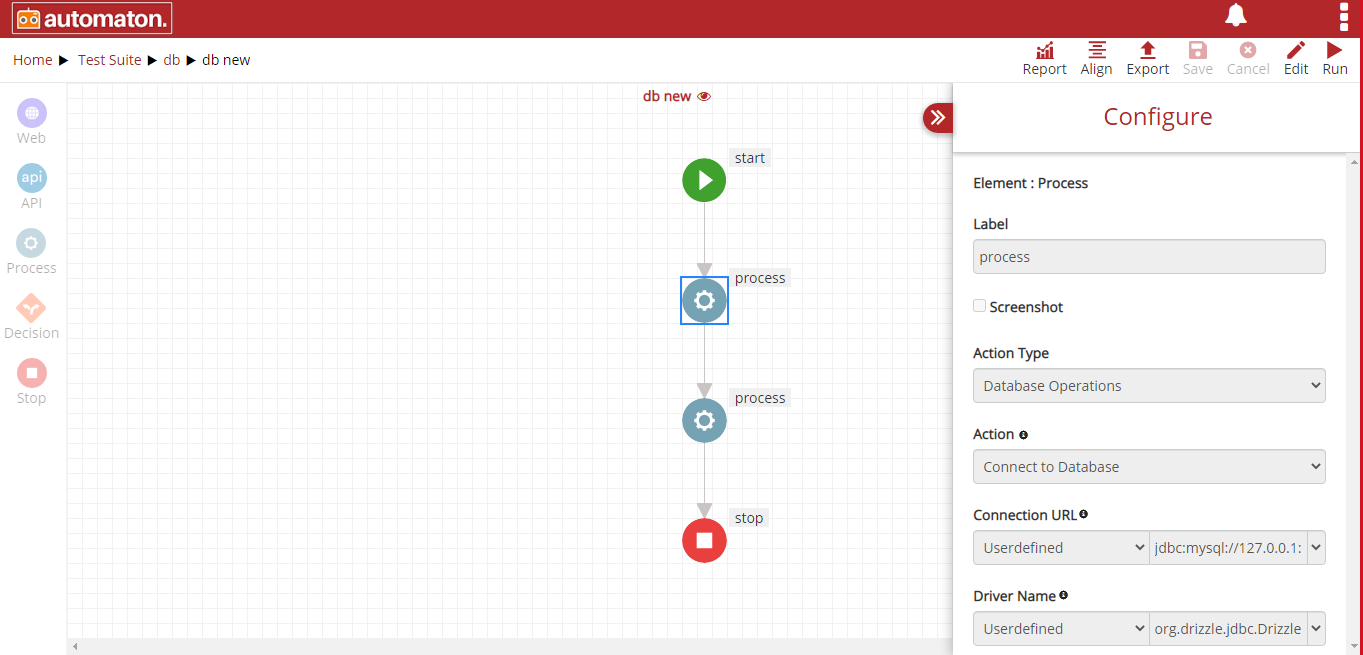
Fig. 4.18 Db Test Case
- On the process element adds ‘Custom’ as Action Type and select the corresponding Custom Group Name as shown below:
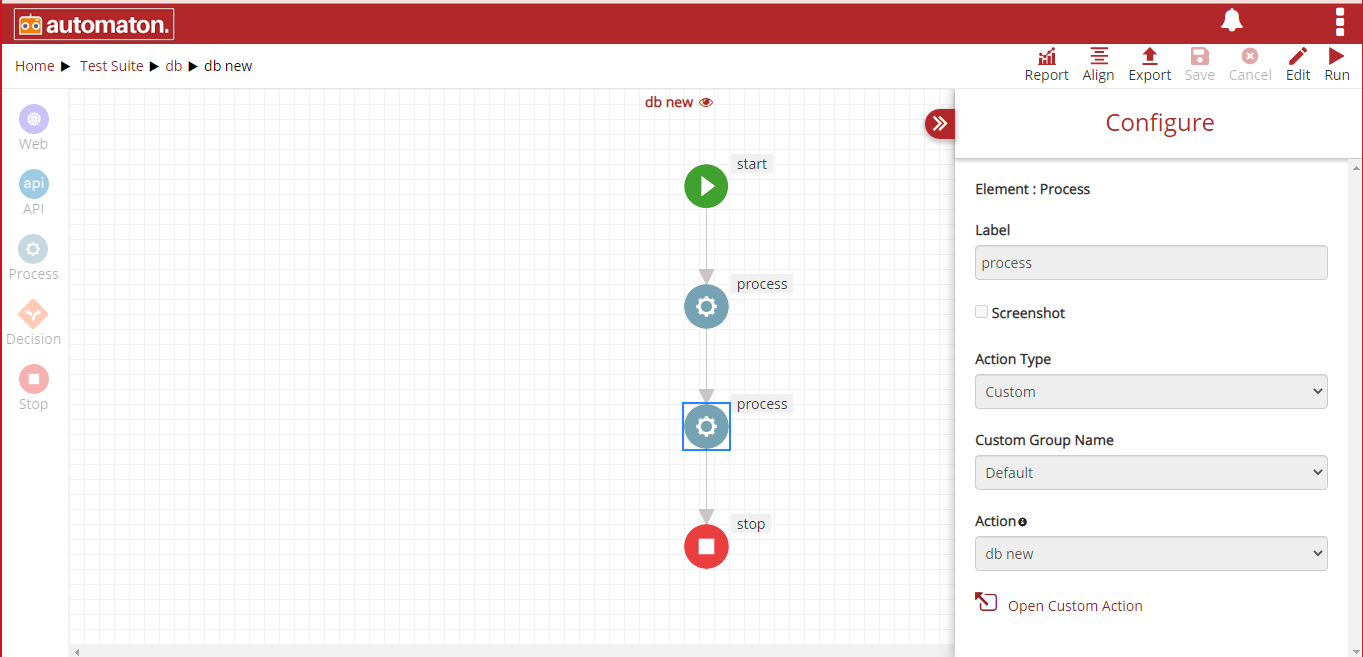
Fig. 4.19 Configure Custom Action in DB
- Once the Action Type and Custom Group Name are selected, then corresponding custom actions will display in the Action field. Users can select the required database custom action. Click on the Open Custom Action to view the custom action flow as shown below:
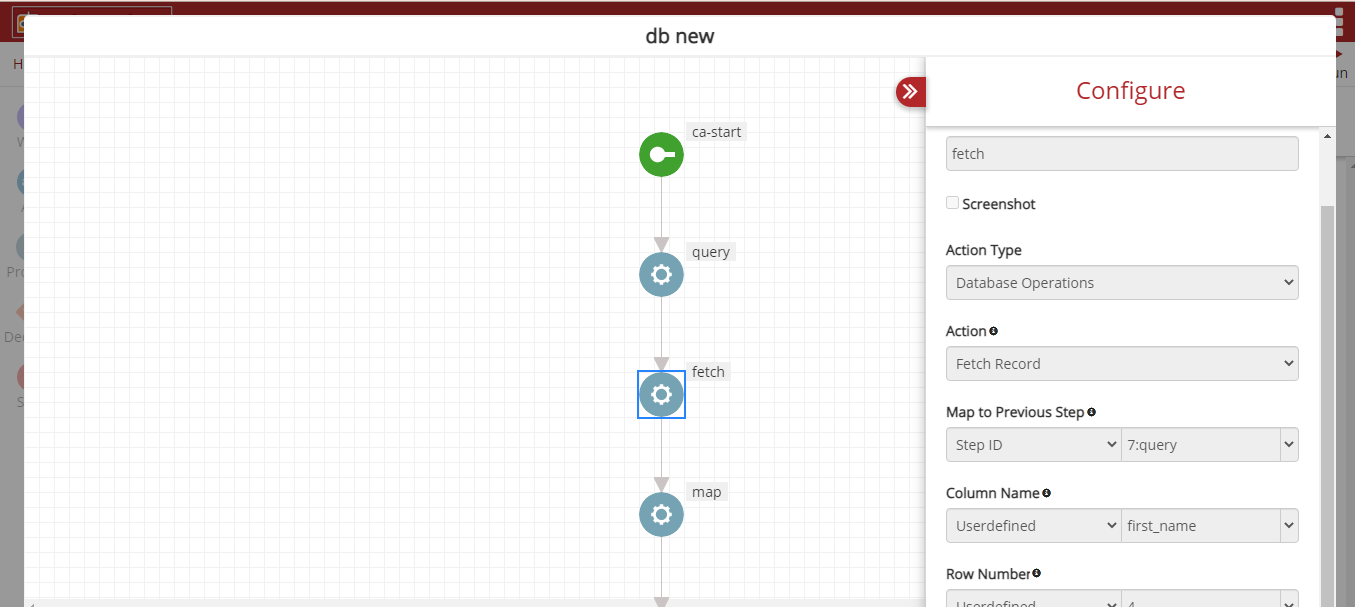
Fig. 4.20 Updating Custom Action
- Here users need to update the custom action like Step ID accordingly.
- Once the user is completed with test case creation click Save > Run and a report will be generated.
- Edit the Custom Actions
To edit a custom action, navigate to Configure> Custom Actions List. Here users can choose a custom action and edit it. But there can be a probability that edited custom action is used in other test cases and those test cases may be used in different test suites. To tackle these dependencies with the test cases and test suites Automaton will give the flexibility to choose the test suite and test case in the Update Custom Action dialog.
- Select any custom action.
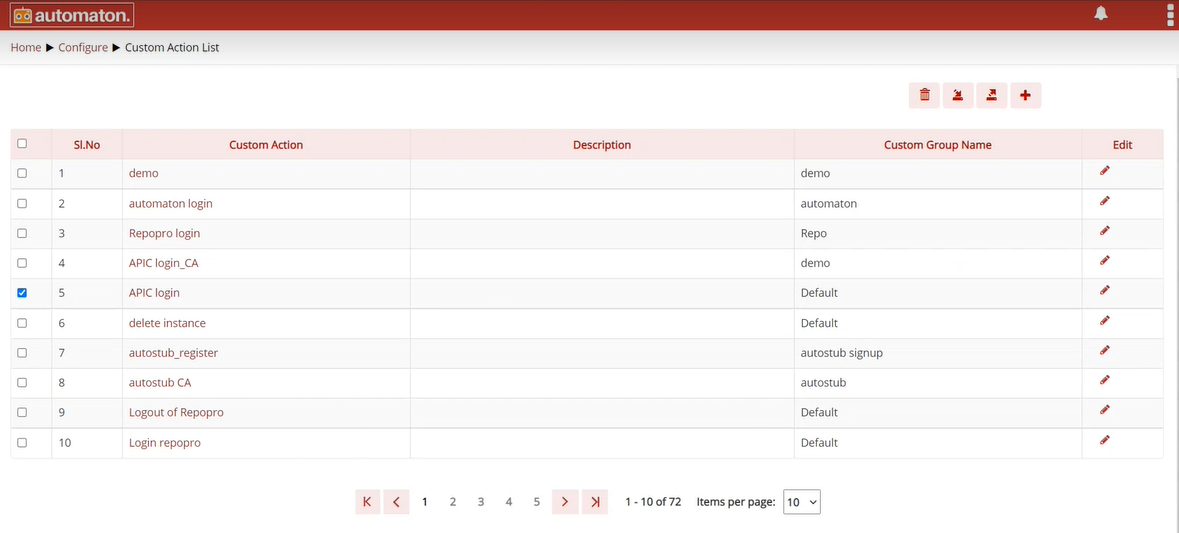
Fig. 4.21 Custom Action List Page
- Click on any custom action to display the corresponding custom action.
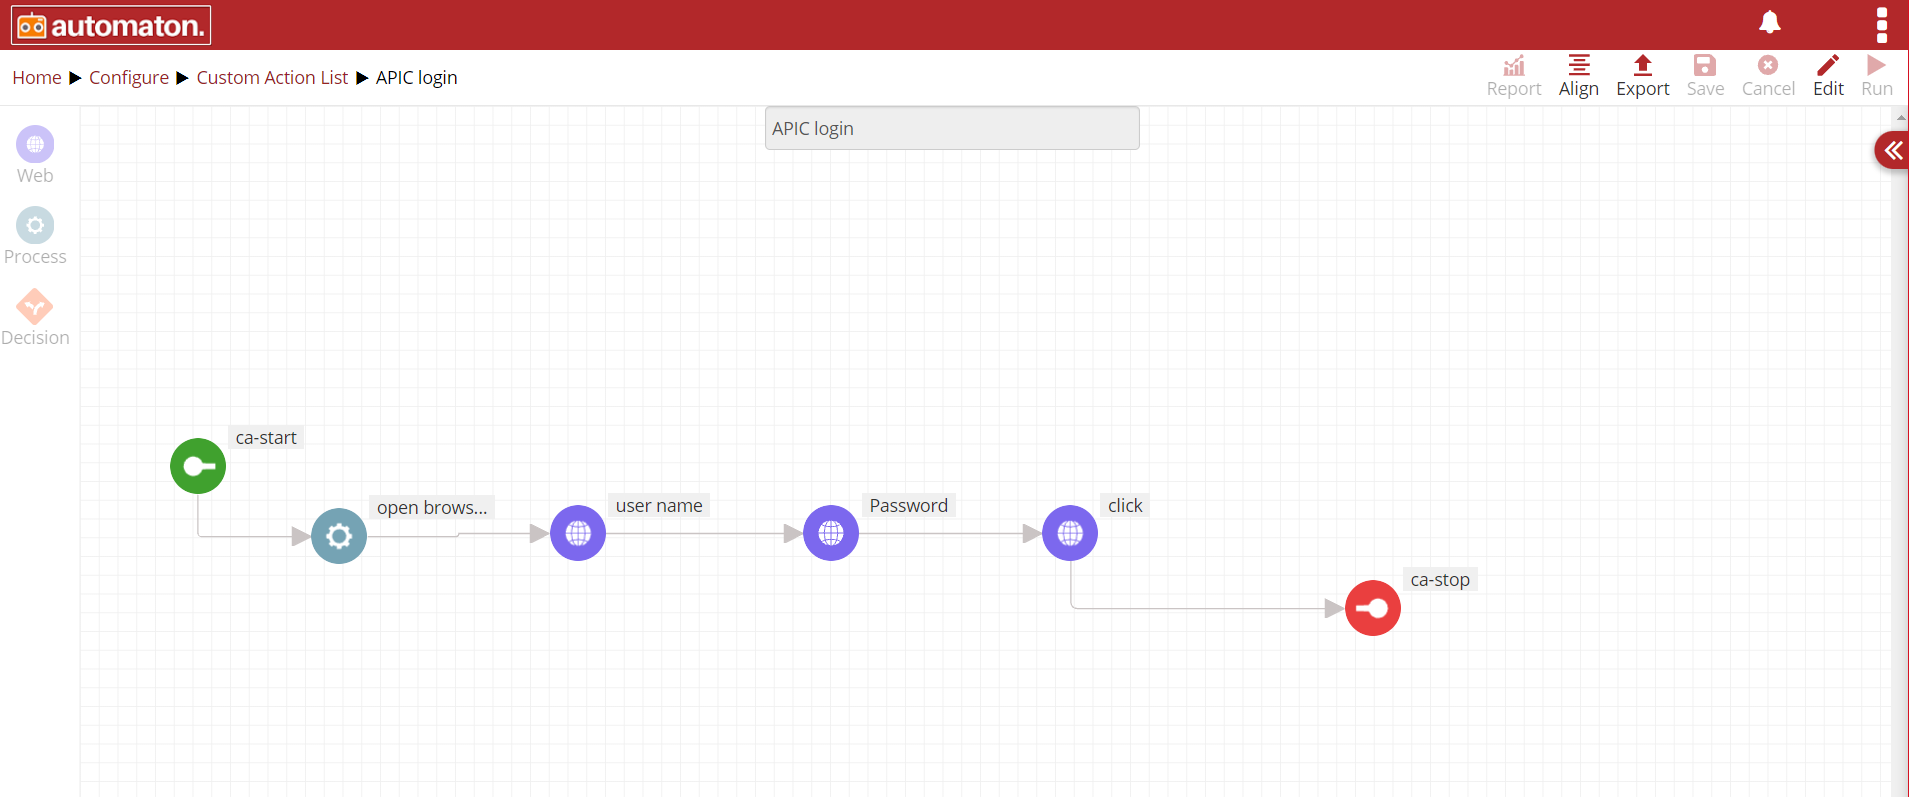
Fig. 4.22 Custom Action Flow
- Click the edit icon
 to edit a custom action.
 - Click the save icon
 an Update Custom Action dialog will be
displayed as shown below:
an Update Custom Action dialog will be
displayed as shown below:
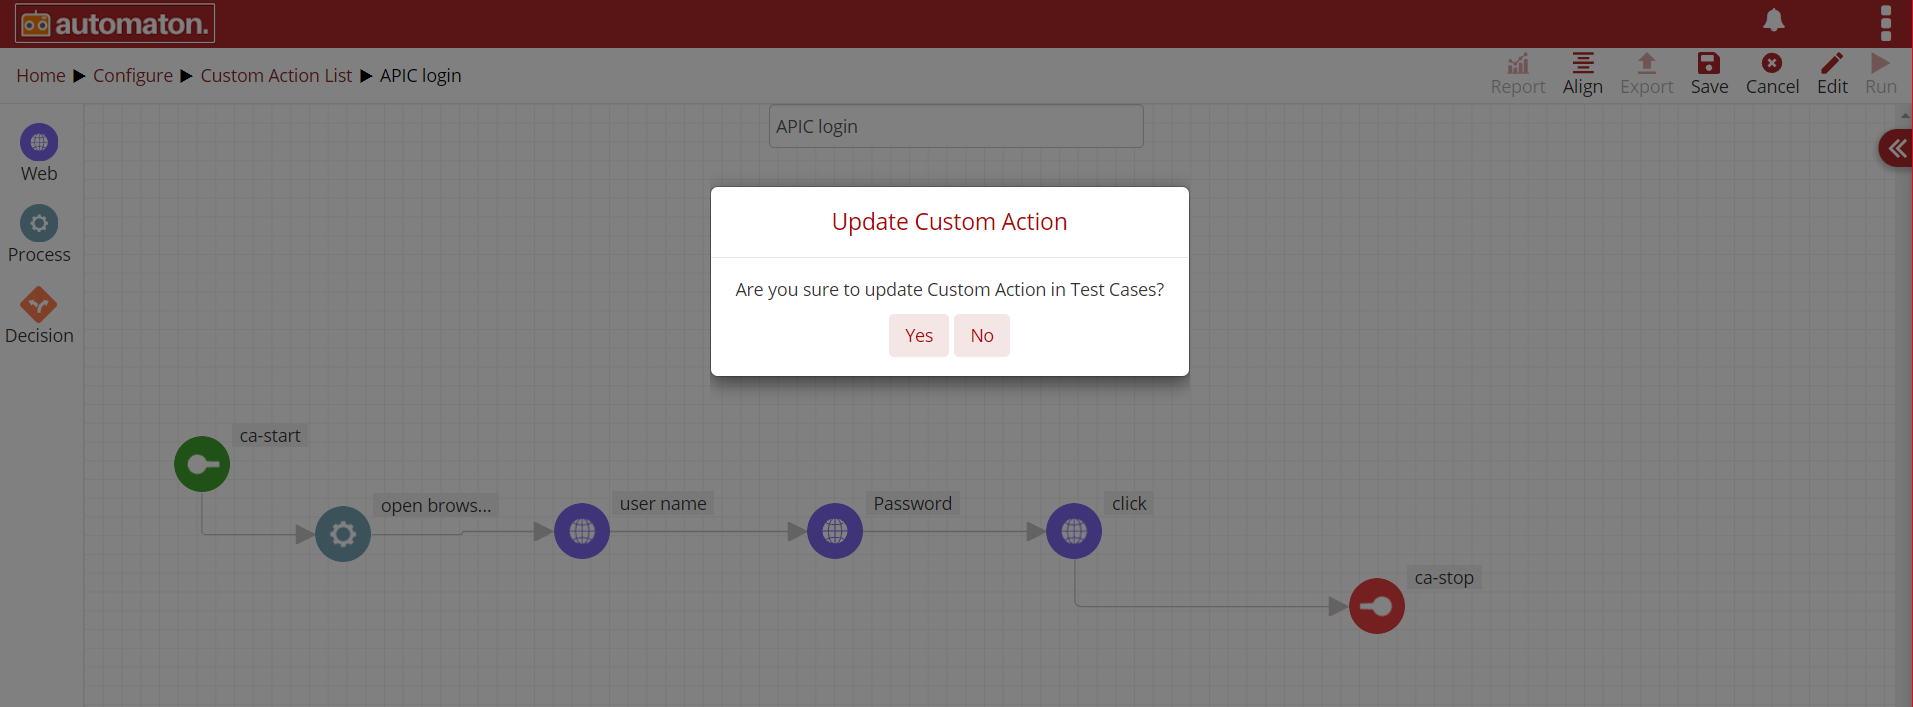
Fig. 4.23 Update Custom Action
Click Yes to update and No to exit.
- Once the user clicks the Yes button in the above step the Update Custom Action dialog will appear with all the test cases along with the corresponding test suite as shown below:
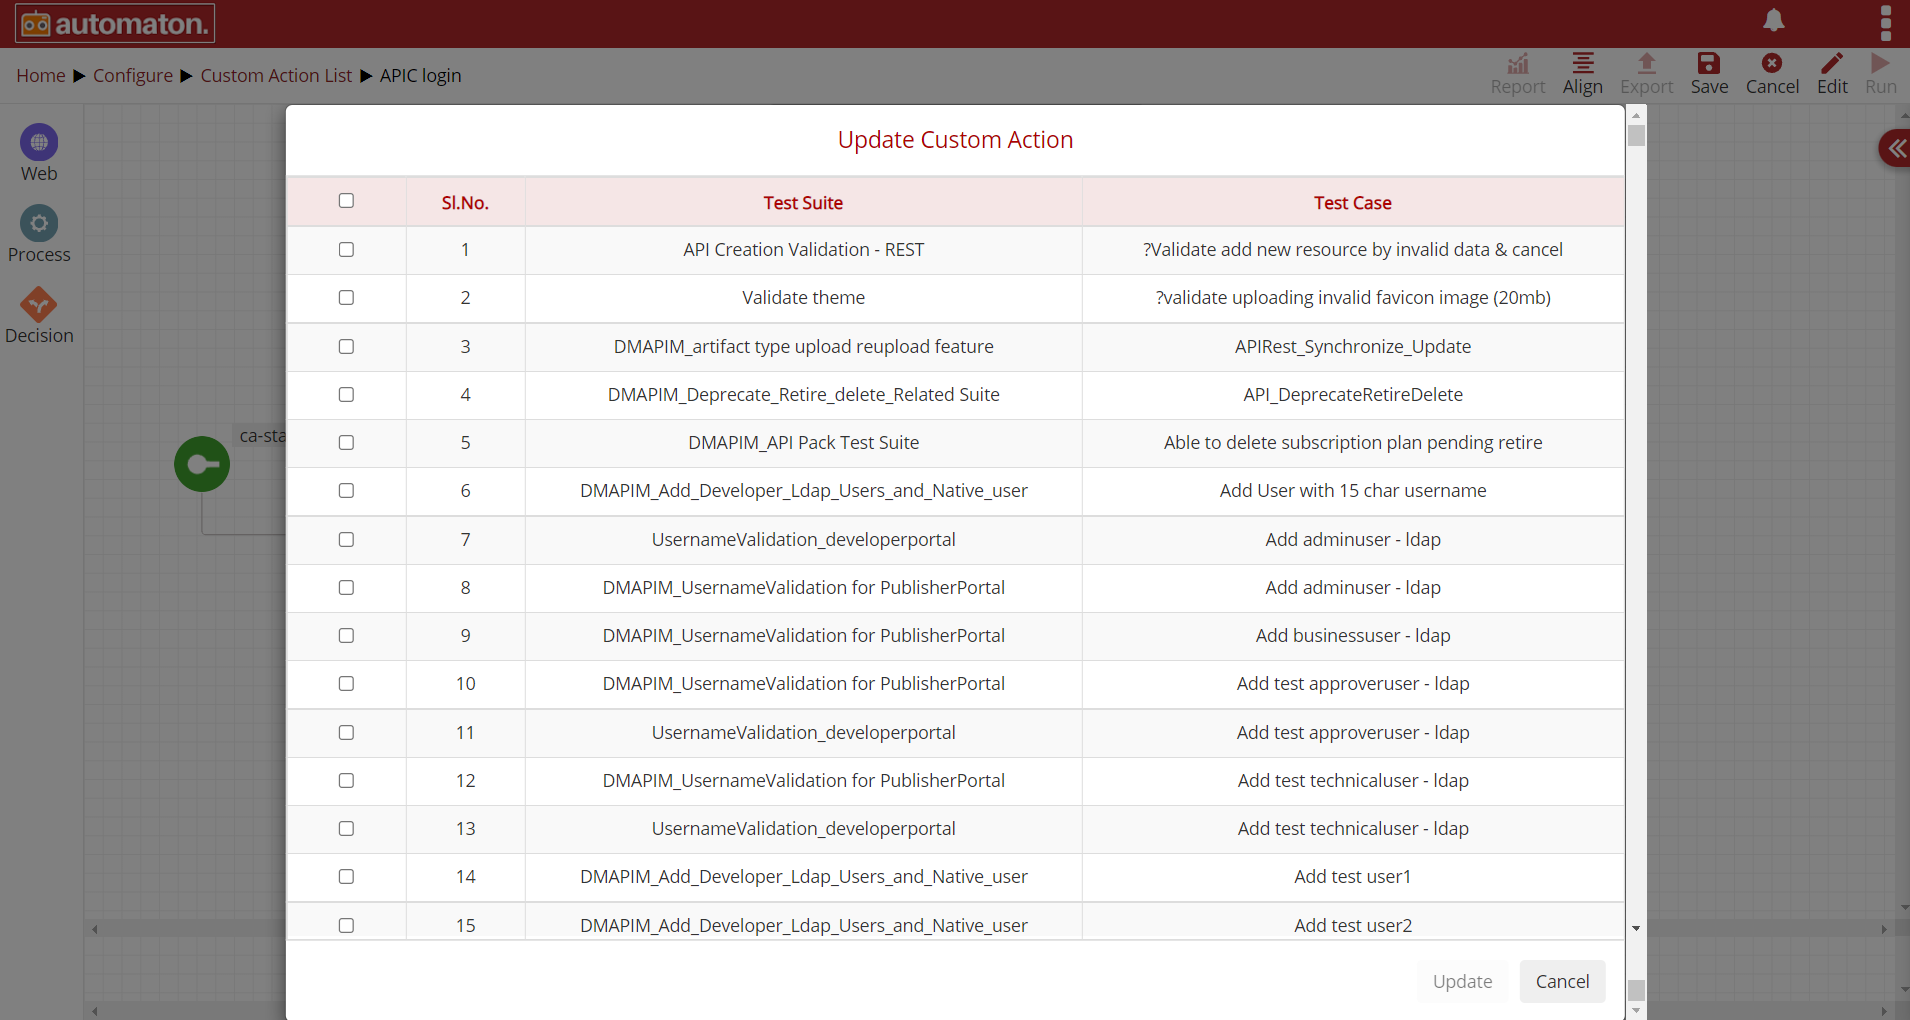
Fig. 4.24 Update Custom Action Dialog
Here user can select the respective test suite and test case for the edited custom action. This helps users to work around the dependencies if the same test case is used in multiple test suites.
Delete Custom Action
Click the delete icon  on the Custom Action page to delete a custom action. The Delete Custom Action dialog will be displayed click the Delete
button to soft delete the custom action and users can delete the same permanently or restore from Trash.
on the Custom Action page to delete a custom action. The Delete Custom Action dialog will be displayed click the Delete
button to soft delete the custom action and users can delete the same permanently or restore from Trash.
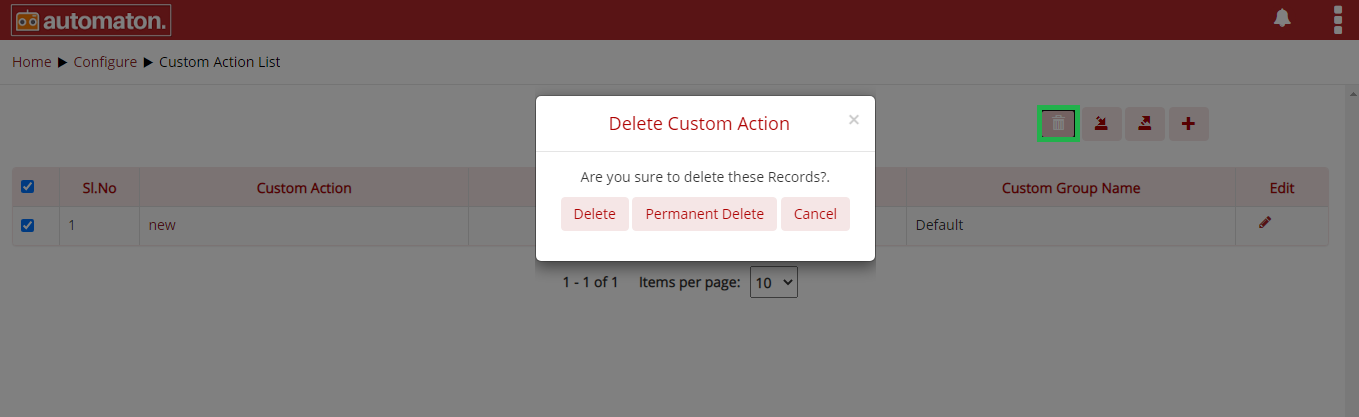
Fig. 4.25 Delete Custom Action
Permanent Delete Custom Action
Click the Permanent Delete button to delete permanently or click Cancel to exit. The items clicked by permanent delete cannot be restored from the trash page.
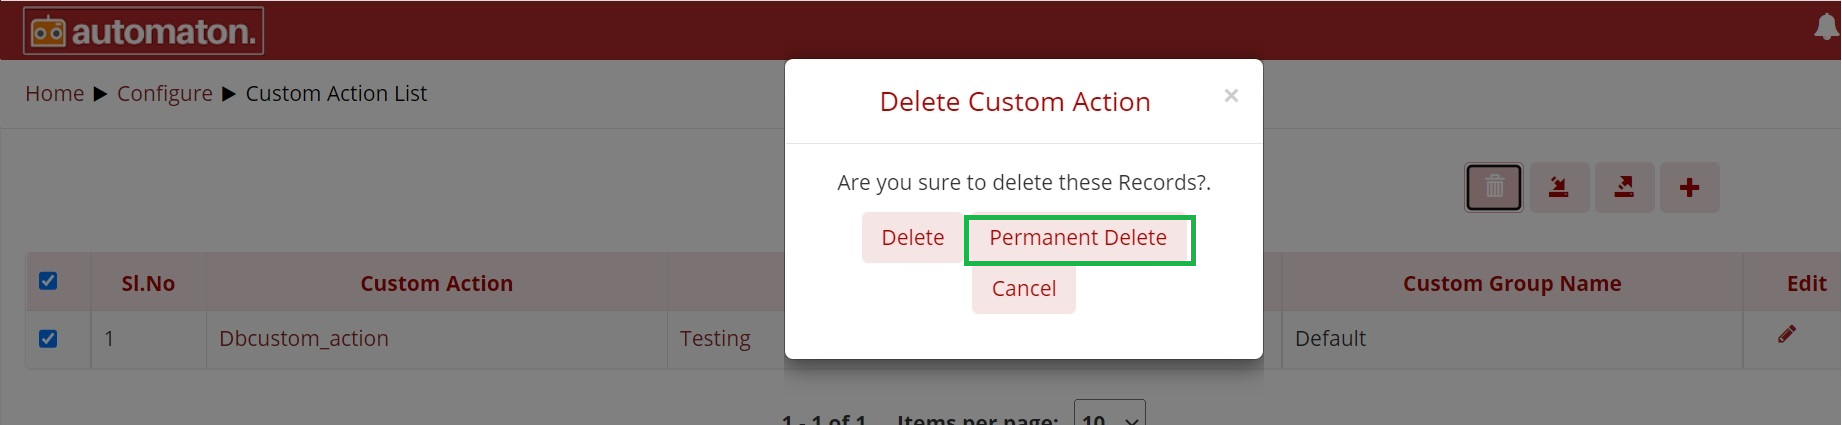
Fig. 4.26 Permanent Delete Custom Action
- Mail Configuration
Mail Configuration is used to send emails from the mail client to a mail server (outgoing mails) and to send mails from the sending mail server to a receiving mail server.
On configuring this, it would send an email after running an execution plan.
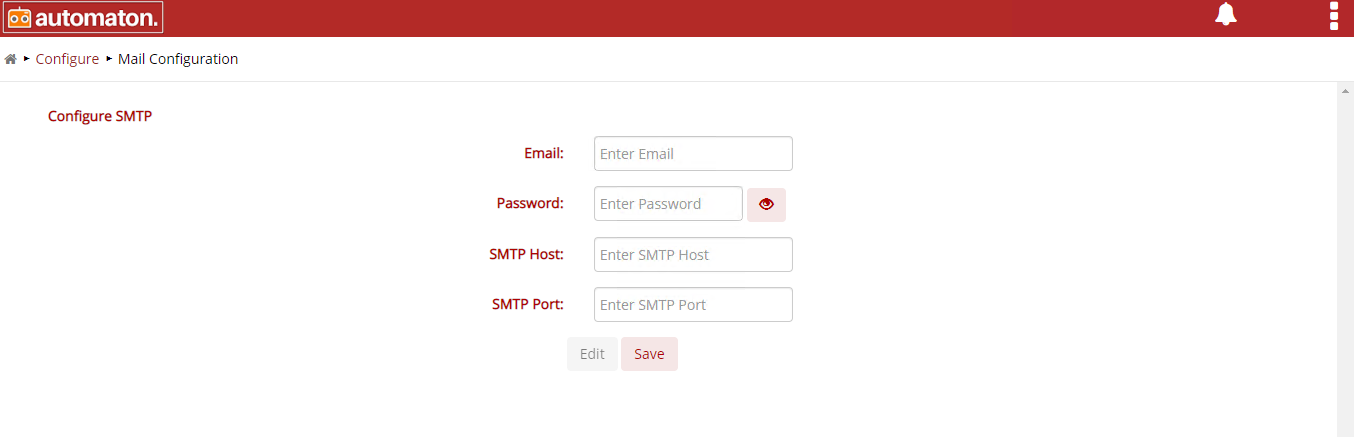
Fig. 4.27 Mail Configuration
The above shown icon is to create test suites by providing name and selecting anyone among API, Database, Log, Mobile test suites.
- Selenium Grid
Users need to initiate Selenium grid to perform the test automaton testcases by running the Hub and register that node to hub and run the node using UI.
Click the Selenium Grid tile will navigate to Selenium Grid page as shown below:
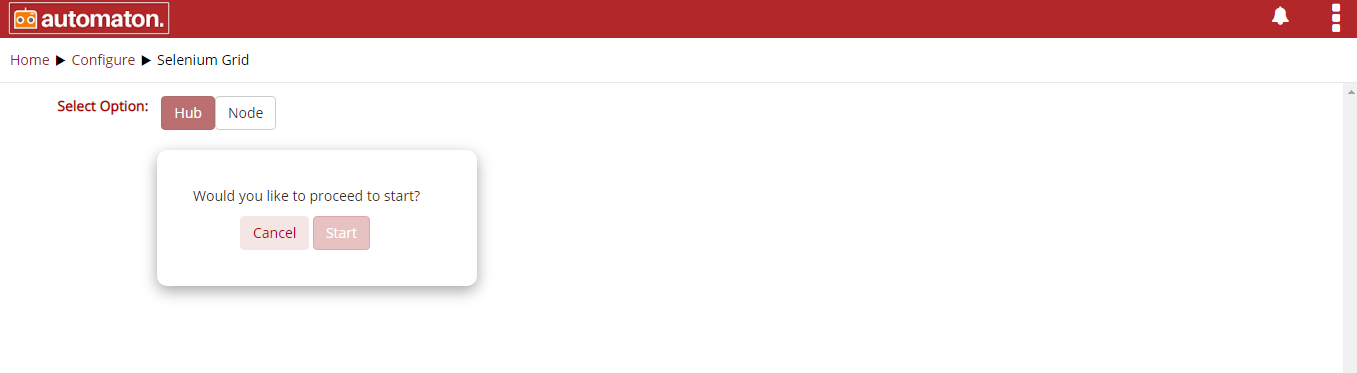
Fig. 4.28 Selenium Grid
The steps for running Hub and register Node are as follows:
- Click the Start button to start the Hub and a success message will be displayed as shown below:
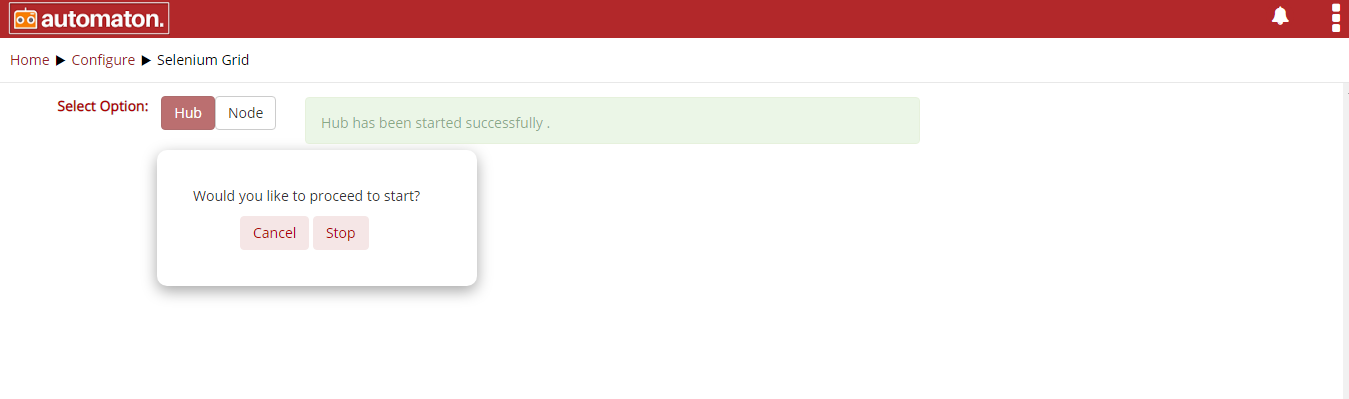
Fig. 4.29 Hub Started Successfully
- Click the Node button to start the nodes as shown below:
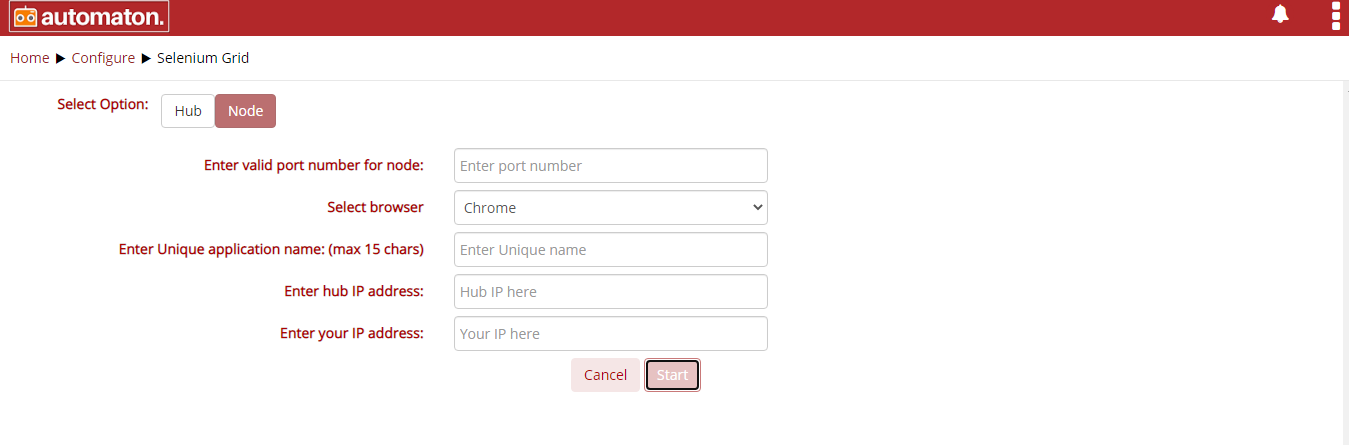
Fig. 4.30 Node Initiated
Here users must provide the details like:
- Enter valid port number for node: User must provide a free port number.
- Select browser: User need to select a browser from the available option.
- Enter Unique application name: User must provide an application name and this name have to same name as launch chrome instance.
- Enter hug IP address: The IP of the hub.
- Enter your IP address: The IP address of the machine.
Click the Start button to start the node as shown below:
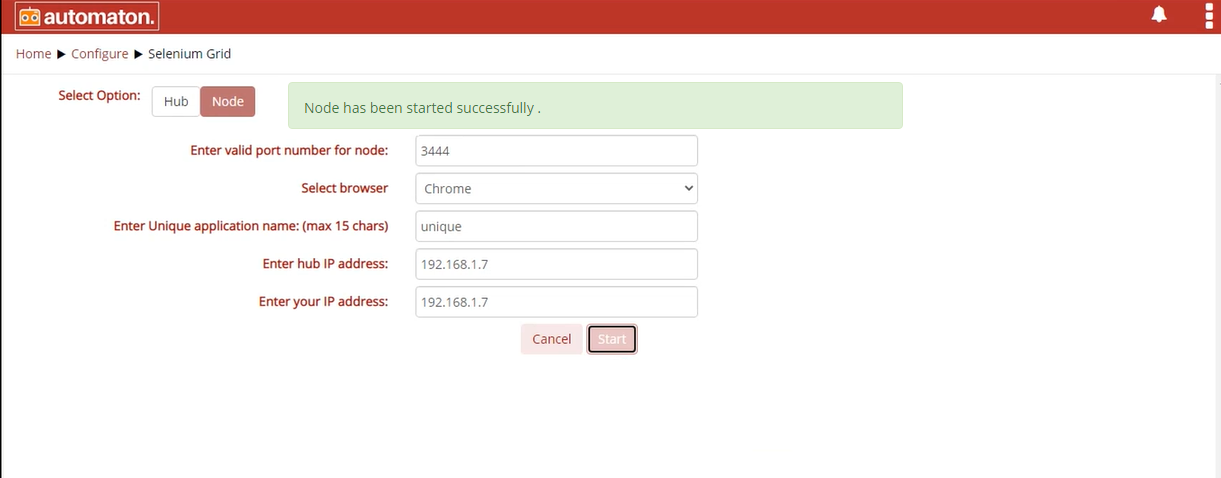
Fig. 4.31 Node Started Successfully
4.4. Reports

Fig. 4.32 Report
The Report icon allows to the users to access the all the reports. It will also display the total number of reports. On clicking the above icon, the Report page will be displayed as shown below:
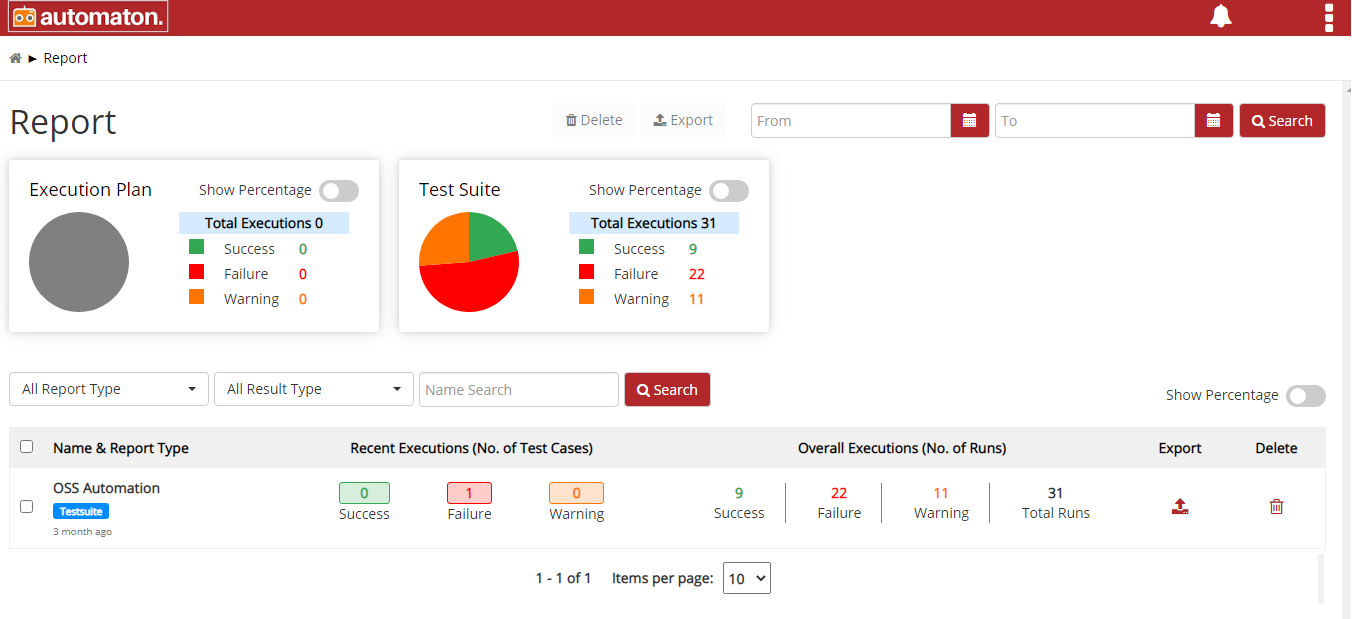
Fig. 4.33 Report Page
On the above page, users can view the overall statistics of the executed Execution Plan and Test Suite as a pie chart. Statistics include Total Executions, Success, Failure, Warning as a number or percentage. Users can switch between numbers or percentages using the toggle button.
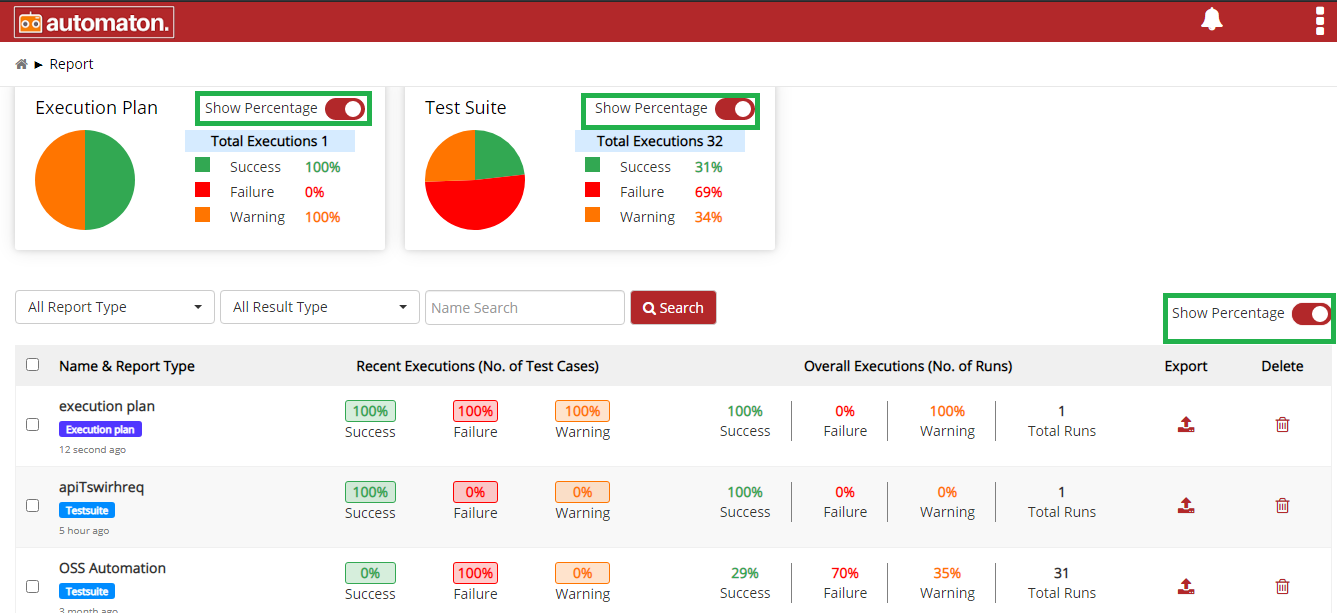
Fig. 4.34 Show Percentage
- To delete multiple Execution plan/Test Suite check the checkbox prefixed to the corresponding Execution plan/Test Suite, the Delete button will be enabled and click to Delete.

Fig. 4.35 Delete
- To export multiple Execution plan/Test Suite check the checkbox prefixed to the corresponding Execution plan/Test Suite, the Export button will be enabled and click to Export.
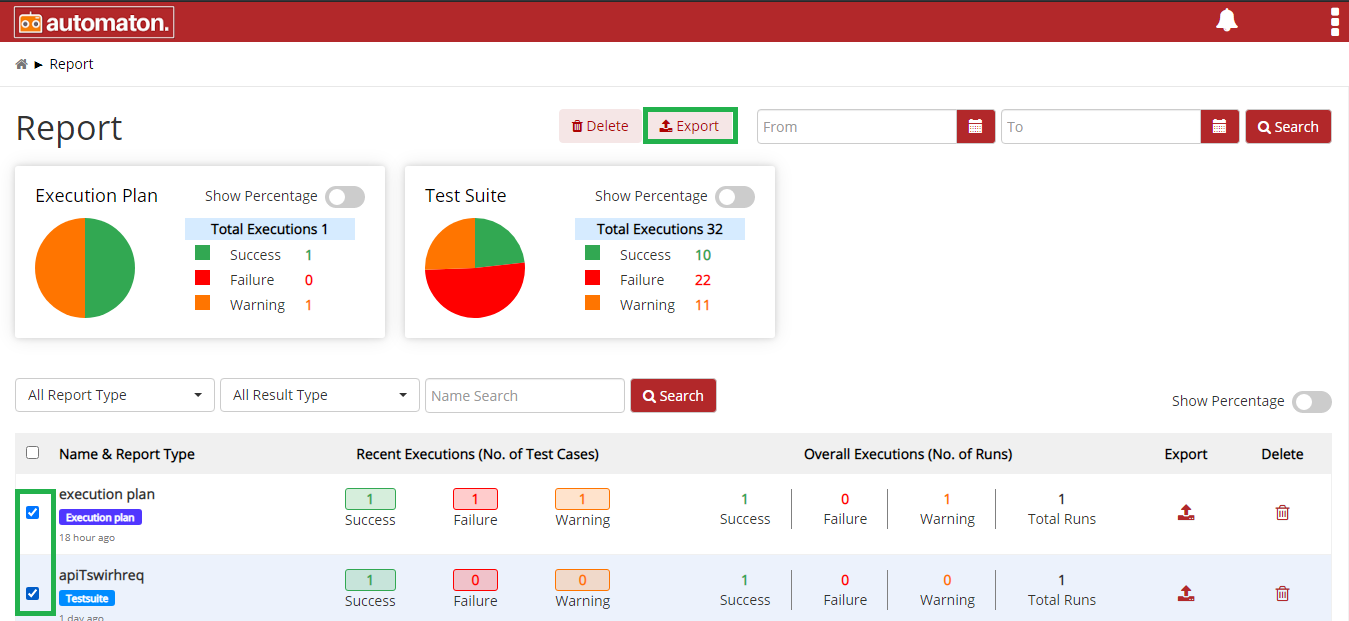
Fig. 4.36 Export
Users can access the Report List to check the status of all executed Execution Plan or Test suites. User has an option to view all the results or apply filters to refine the search results.
- Search results can be filtered based on From and To date and click Search.
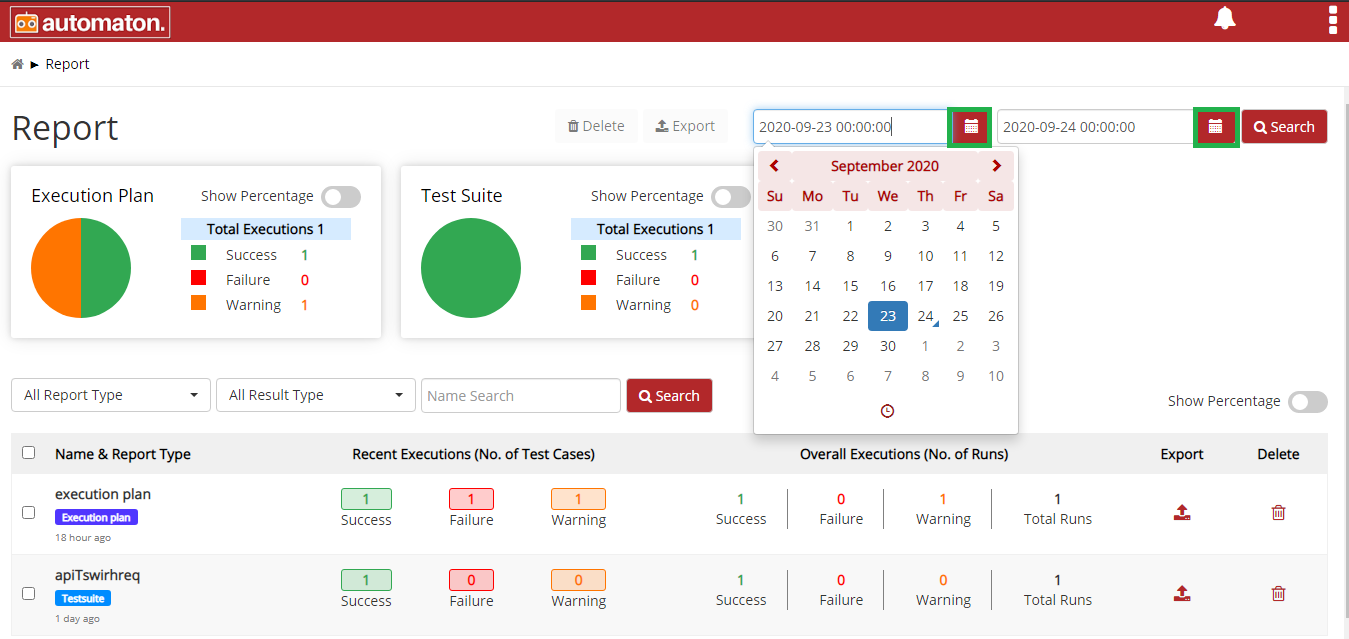
Fig. 4.37 Search with From and To Date
- All Report Type: Click the dropdown list to select any one of the options: All Report Type/Execution Plan/Test Suite. Select any and click Search the corresponding results will be displayed as shown below:
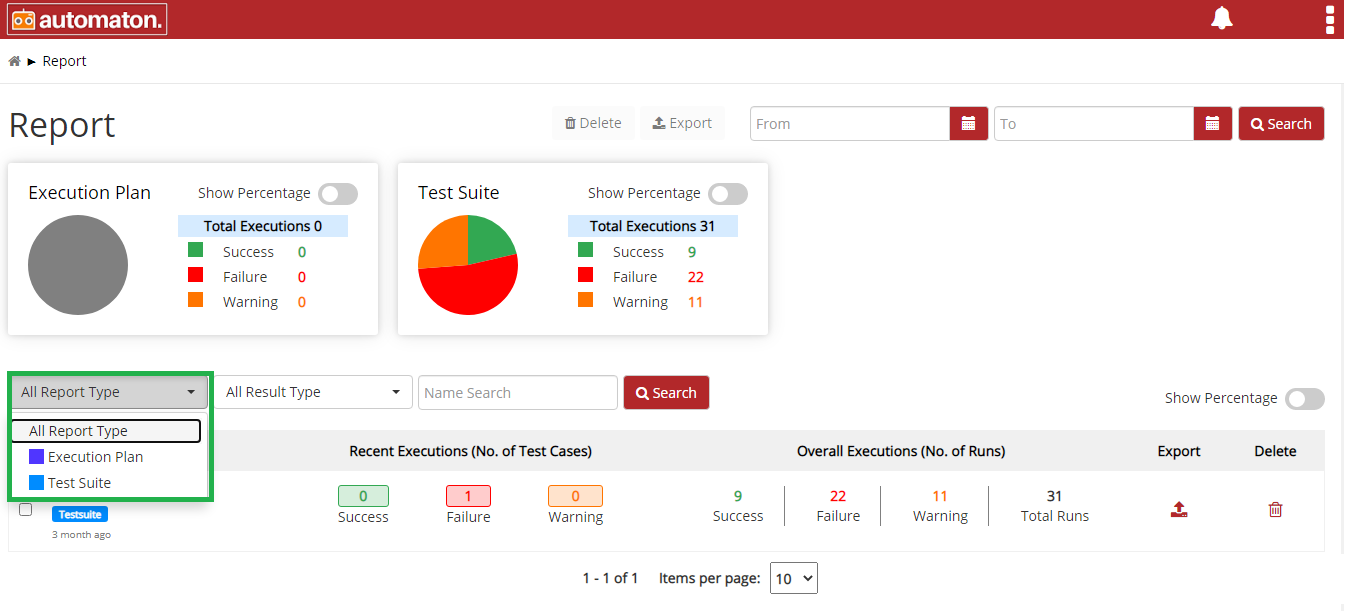
Fig. 4.38 Search Options
- All result Type: Click the dropdown list to select any one of the options: Success/Failure/Warning. Select any and click Search the corresponding results will display as shown below:
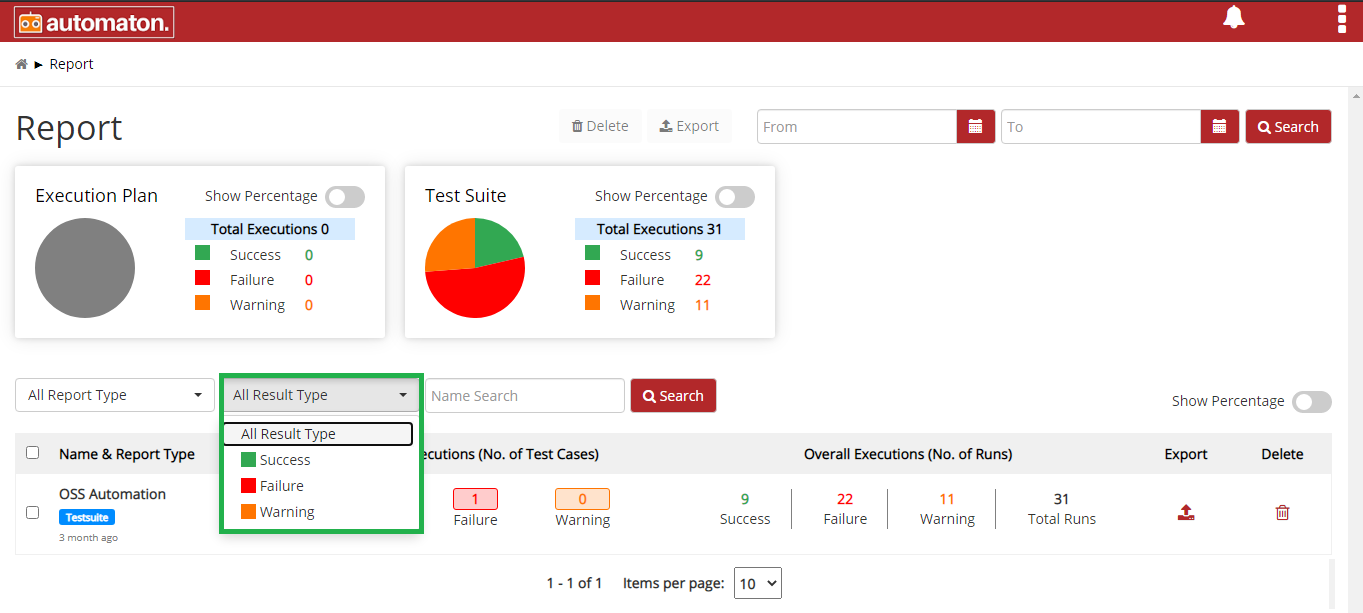
Fig. 4.39 All Result Type
- Name Search: Allows users to search by giving a phrase or a key value. It is recommended to populate this field with relevant information so that locating through search will be quicker.
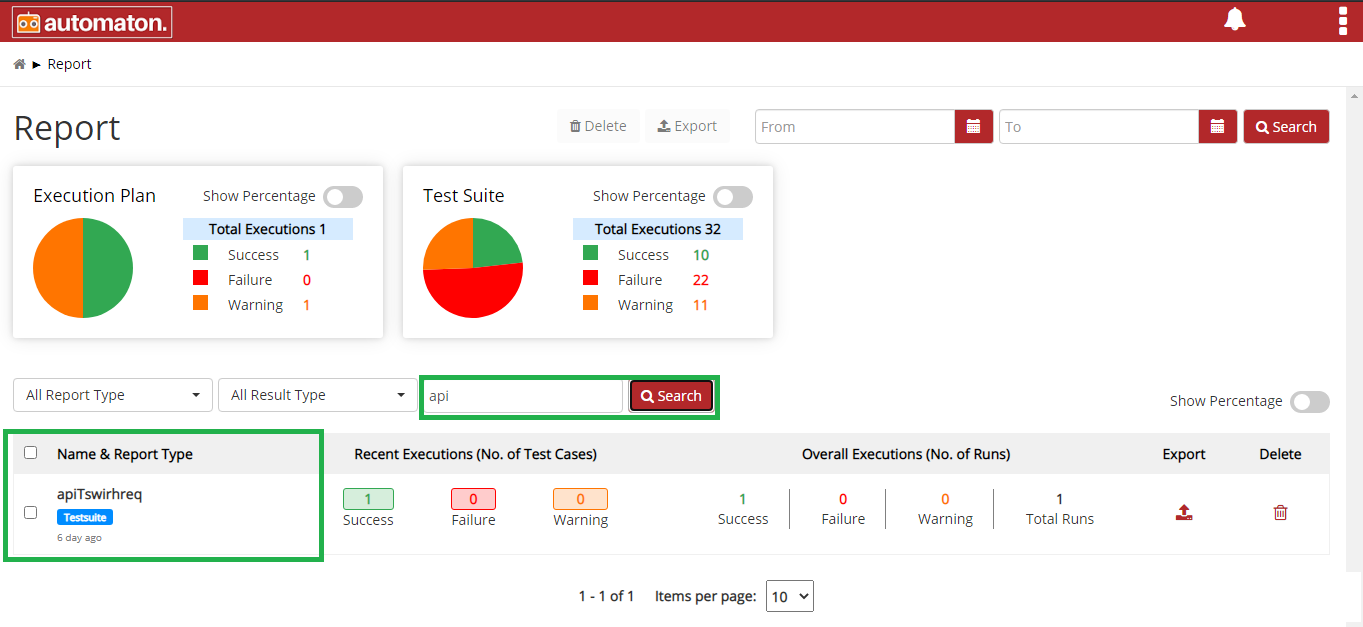
Fig. 4.40 Name Search
Name & Report Type: It displays the name of the Execution plan/Test Suite. Below the name, it will display the type(Execution plan
 /Test Suite
 ) with respective
color codes.
) with respective
color codes.Users can click on the name to view the detailed report as shown below:
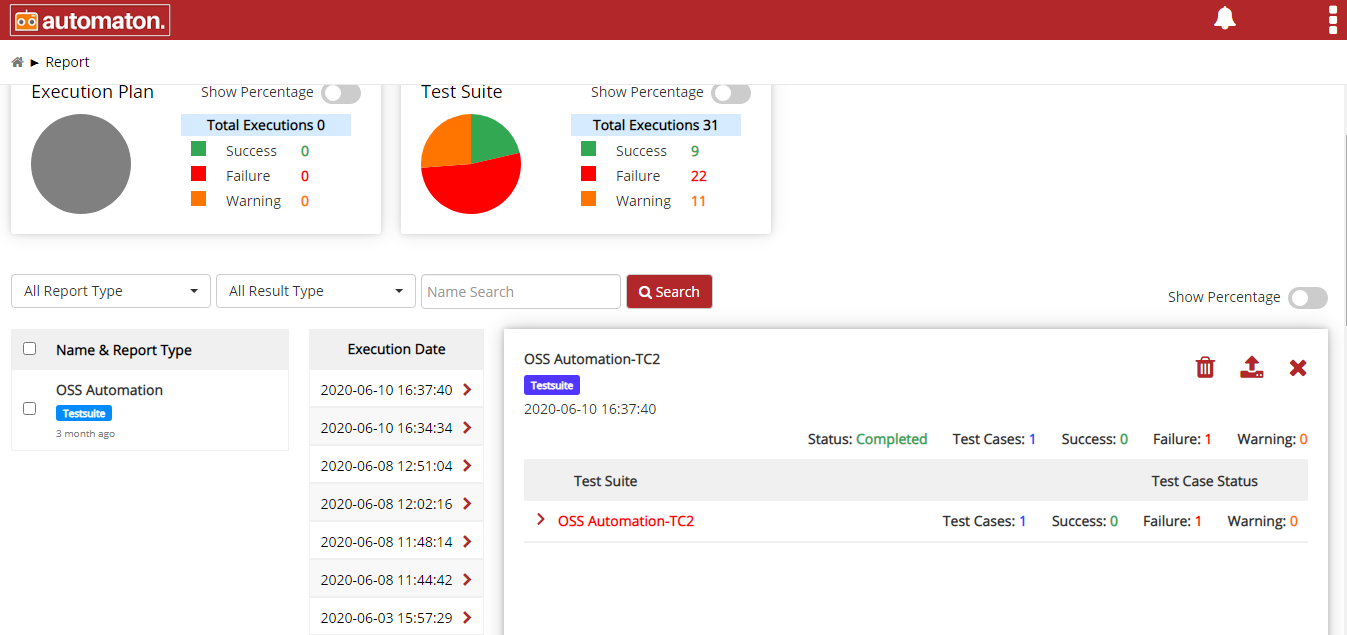
Fig. 4.41 Detailed Report
Here users can see:
- Execution Date: It will list all the executions on the selected
Execution plan/Test Suite along with the date and time. Users can
click on any dates to see the detailed report on the right panel. It will
display Name & Type, Status, Number of Test cases executed, Success,
Failure, Warning. For more details, users can click on the particular
Execution plan/Test Suites. It will display all elements with status
(success, fail, or warning) with color code. The Red color
element shows a failed node and the green color denotes success
node and the Orange color node denotes warning.
- Click the icon to delete the report.
- Click the
 icon to export the report.
 - Click the
 icon to close the page.
- Click the
- Execution Date: It will list all the executions on the selected
Execution plan/Test Suite along with the date and time. Users can
click on any dates to see the detailed report on the right panel. It will
display Name & Type, Status, Number of Test cases executed, Success,
Failure, Warning. For more details, users can click on the particular
Execution plan/Test Suites. It will display all elements with status
(success, fail, or warning) with color code. The Red color
element shows a failed node and the green color denotes success
node and the Orange color node denotes warning.
Recent Executions (No. of Test Cases): It displays the separate count of Success, Failure, Warning if an Execution plan/Test Suite had recently been executed.
Overall Executions (No. of Runs): It displays the total number of executions so far on Execution Plan/Test Suites.
Export: Click the
icon to export the corresponding
report in the Report List.Delete: Click the
icon to delete the corresponding
report in the Report list.
4.5. Execution Plan
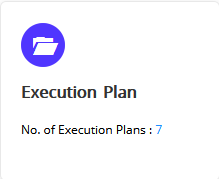
Fig. 4.42 Execution Plan
You can access execution plans by tapping above icon. It will also display the total number of execution plans. Execution plans can be viewed or modified as per your requirements.
The Execution plans can be created for already existing test suites and test cases. Here is how.
Step 1: Click on Test Suite tile on the home page. On clicking it you will navigate to Test Suite Page.
Step 2: Select the Test Suite for which you want to create an Execution plan.
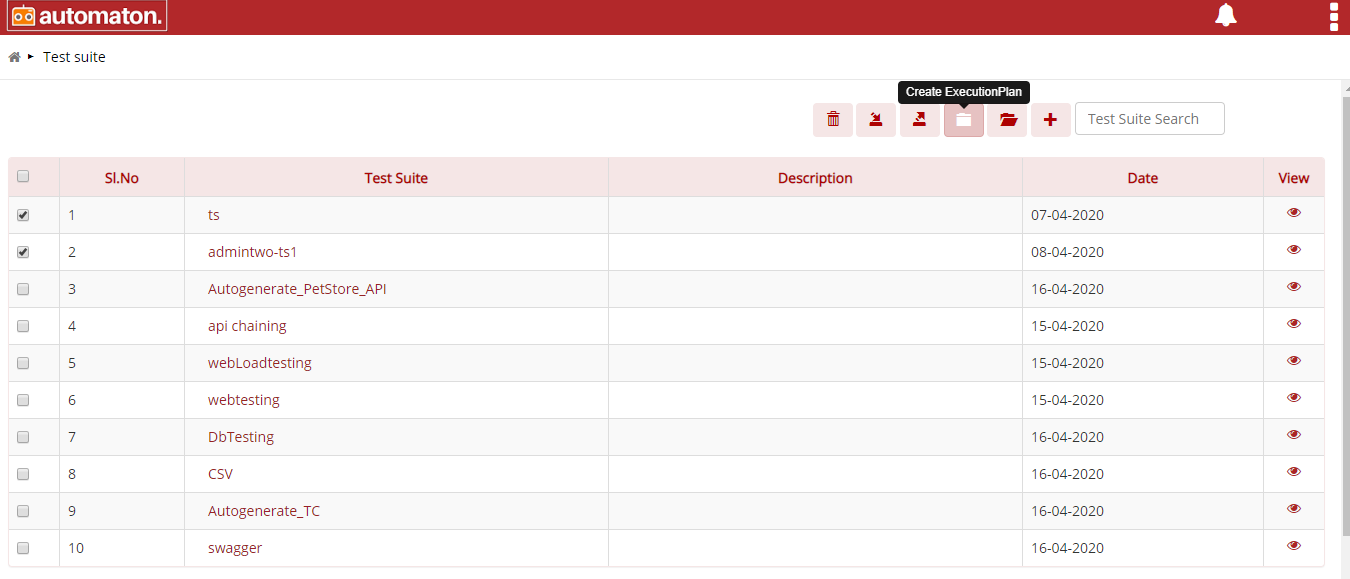
Fig. 4.43 Create Execution Plan
On clicking the Create Execution Plan user will navigate to Create Execution Plan page.
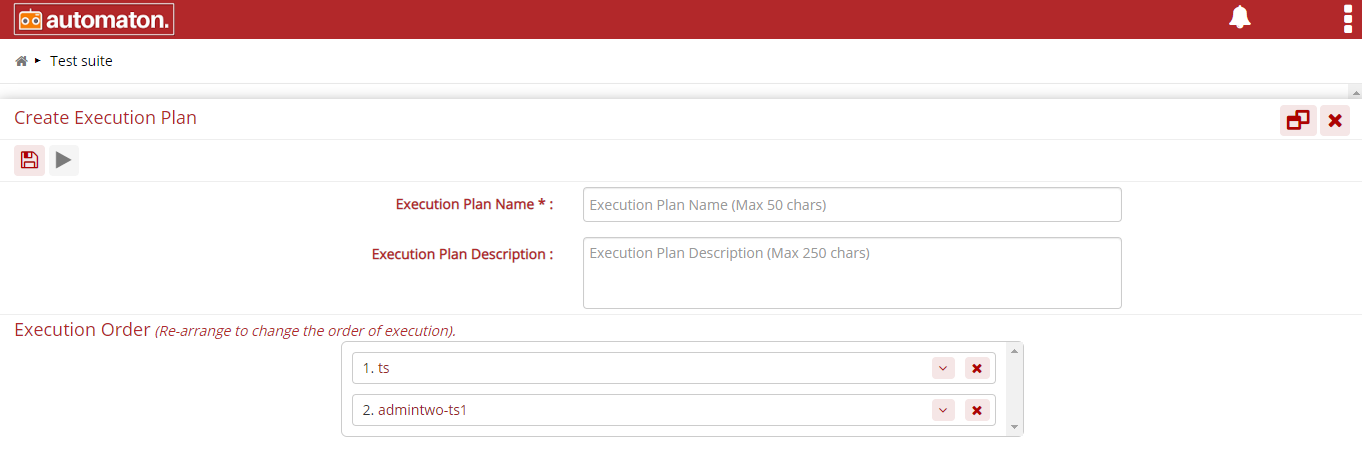
Fig. 4.44 Execution Plan
Execution Plan Name: A name for the execution plan. It is a mandatory field.
Execution Plan Description: A description about execution plan. It is an optional field.
Execution Order: Here it will display the selected test suite/test case for creating an execution plan. User can rearrange the order if required.
Run: To run the execution plan.
Save: To save the execution plan. Once the user saves the execution plan it will display in the Execution plan list page.
Once the user creates an execution plan it will display on the Execution Plan page as shown below:
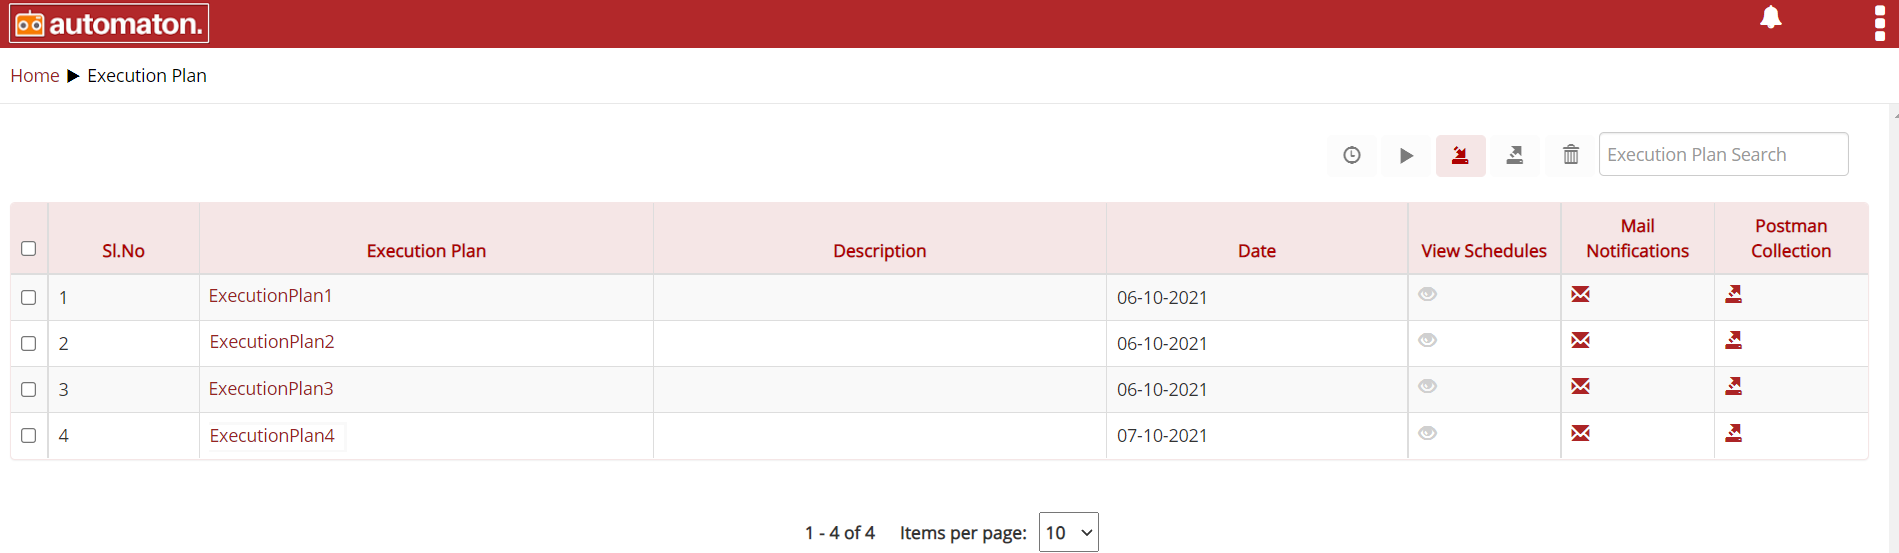
Fig. 4.45 Execution Plan
Click on any Execution Plan name and click the edit icon
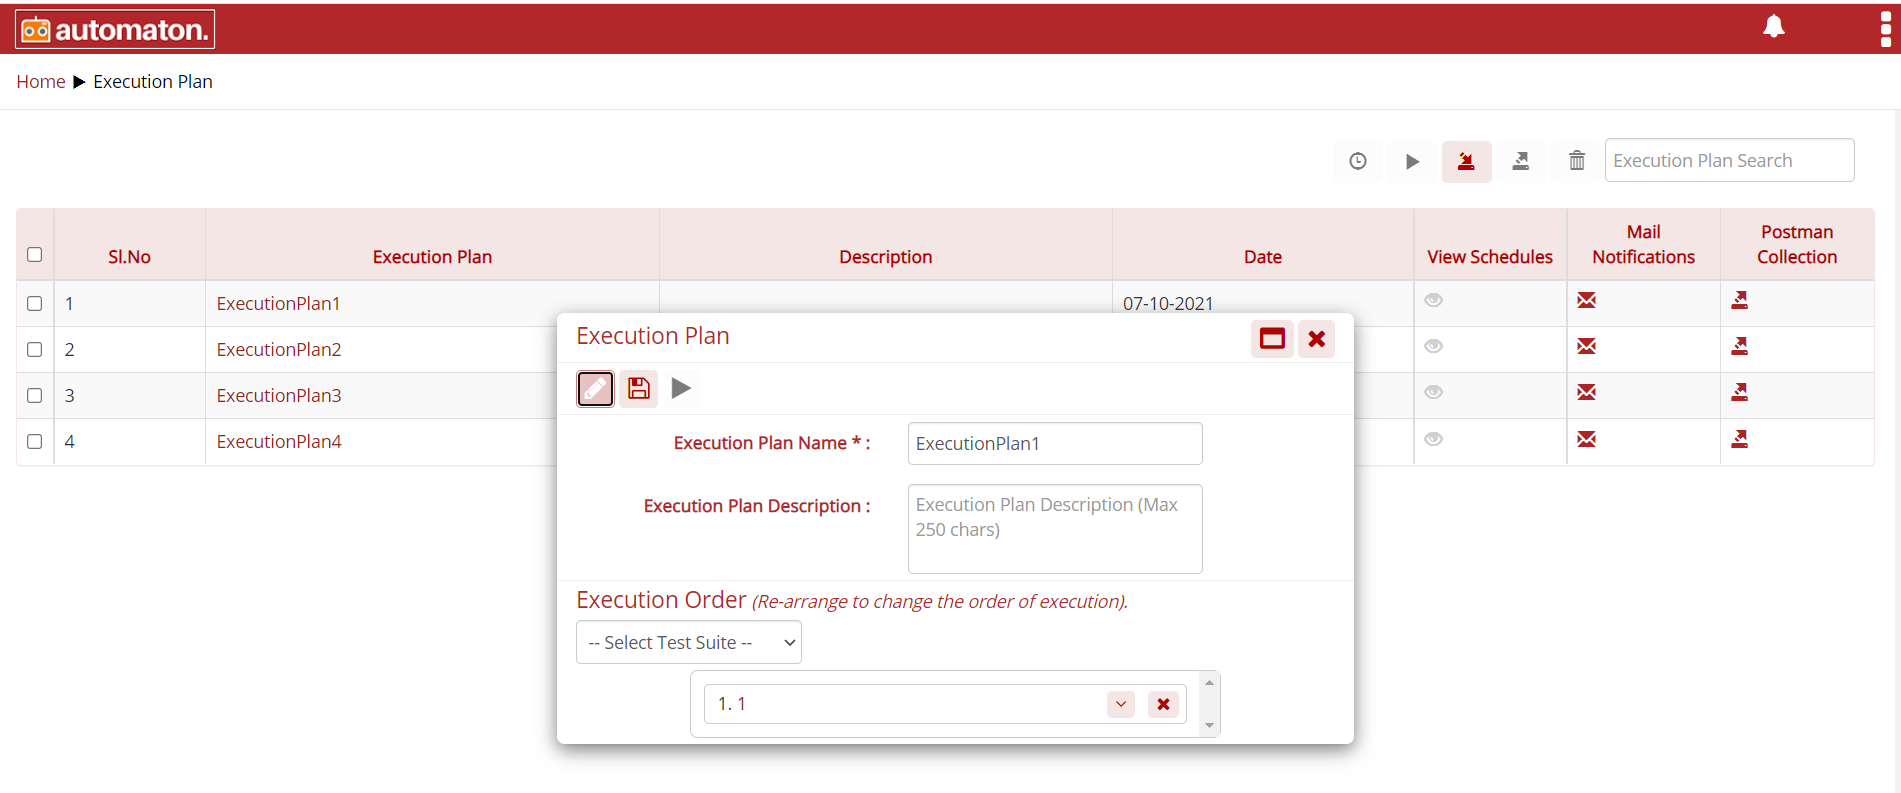
Fig. 4.46 Edit Execution Plan
Click the Save icon
Scheduler:
The execution plan allows the user to schedule a task to run in a user-defined time or date. When it hits the time or date provided by user, the task will execute, and report will be generated. The user must follow the below steps to schedule an execution plan:
- Click the scheduler icon
as shown below:
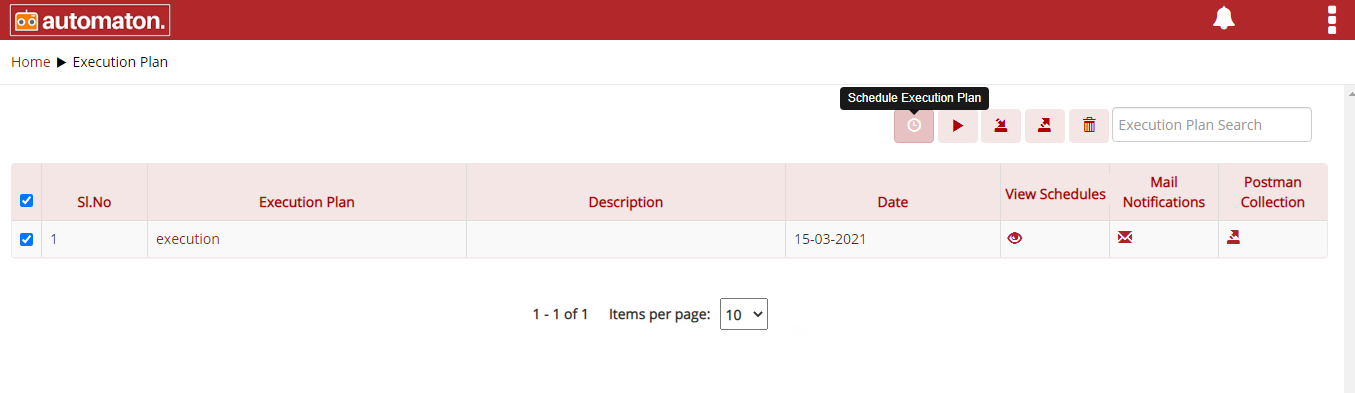
Fig. 4.47 Schedule Execution Plan
- Schedule the required date by clicking the calendar icon
the Execution Plan Scheduler dialog will be displayed where user can schedule date as shown below:
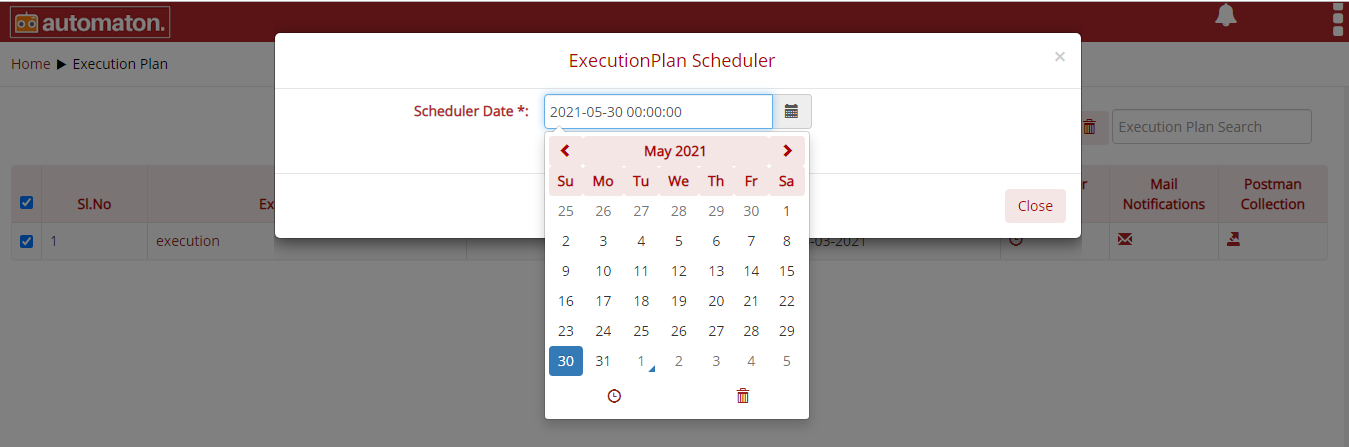
Fig. 4.48 Scheduler
- Click the scheduler icon
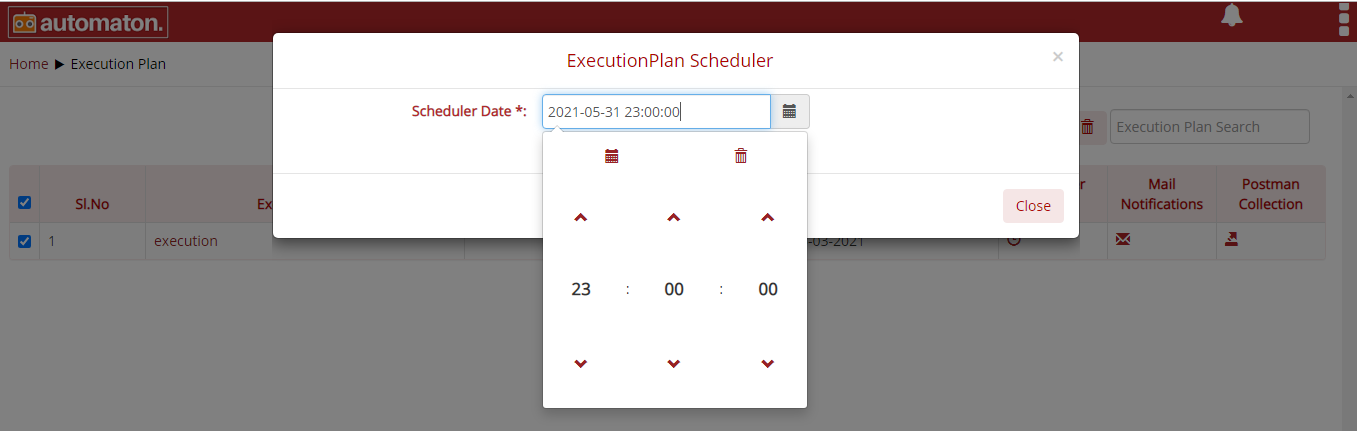
Fig. 4.49 Schedule Time
- Once the user provided the time and date a success message will be displayed as shown below:
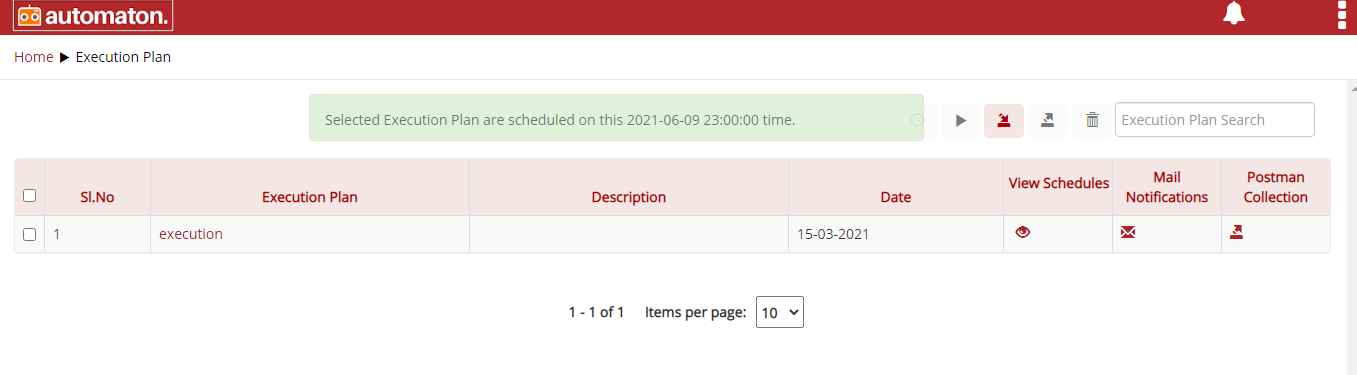
Fig. 4.50 Scheduler Success Message
Note
The View Schedules icon ![]() will be enabled once the user schedules an execution plan.
will be enabled once the user schedules an execution plan.
To view the scheduled task, click on the corresponding scheduler icon
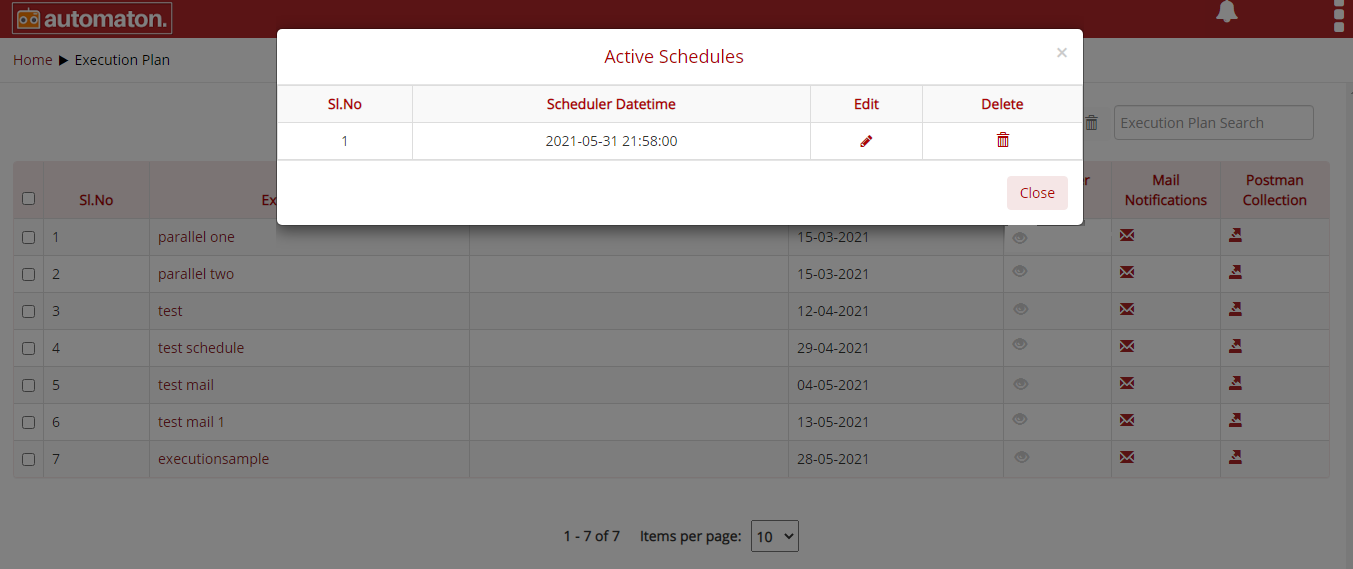
Fig. 4.51 Active Schedules
On the above dialog users can click on the edit icon
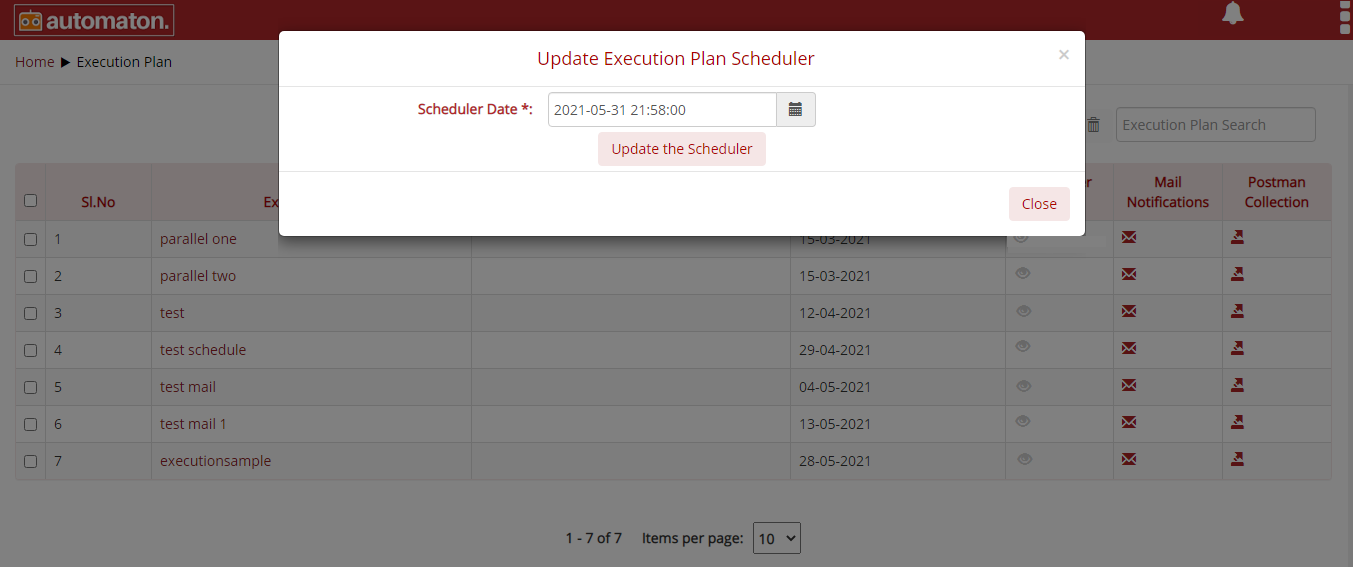
Fig. 4.52 Update Scheduler
Click the delete icon
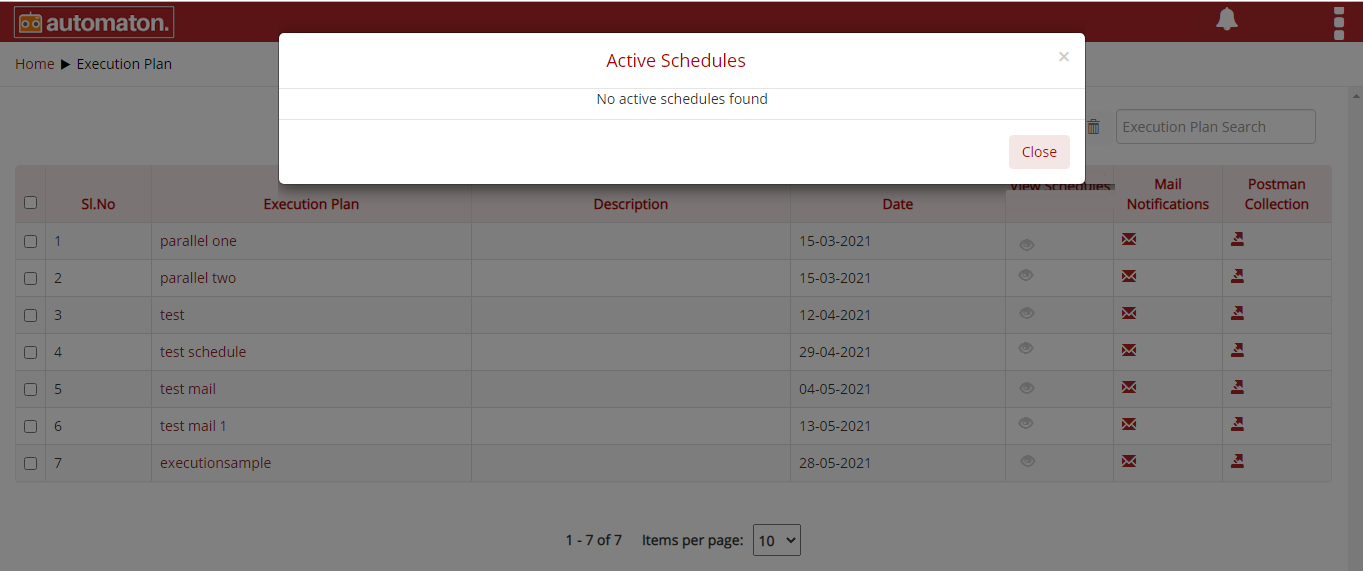
Fig. 4.53 Delete Scheduler
Push Notification
Once the user sets the scheduler, a notification or reminder will be displayed before it starts the execution and ends execution. To notify this a bubble with the number of notifications will display in the notification icon as shown below:
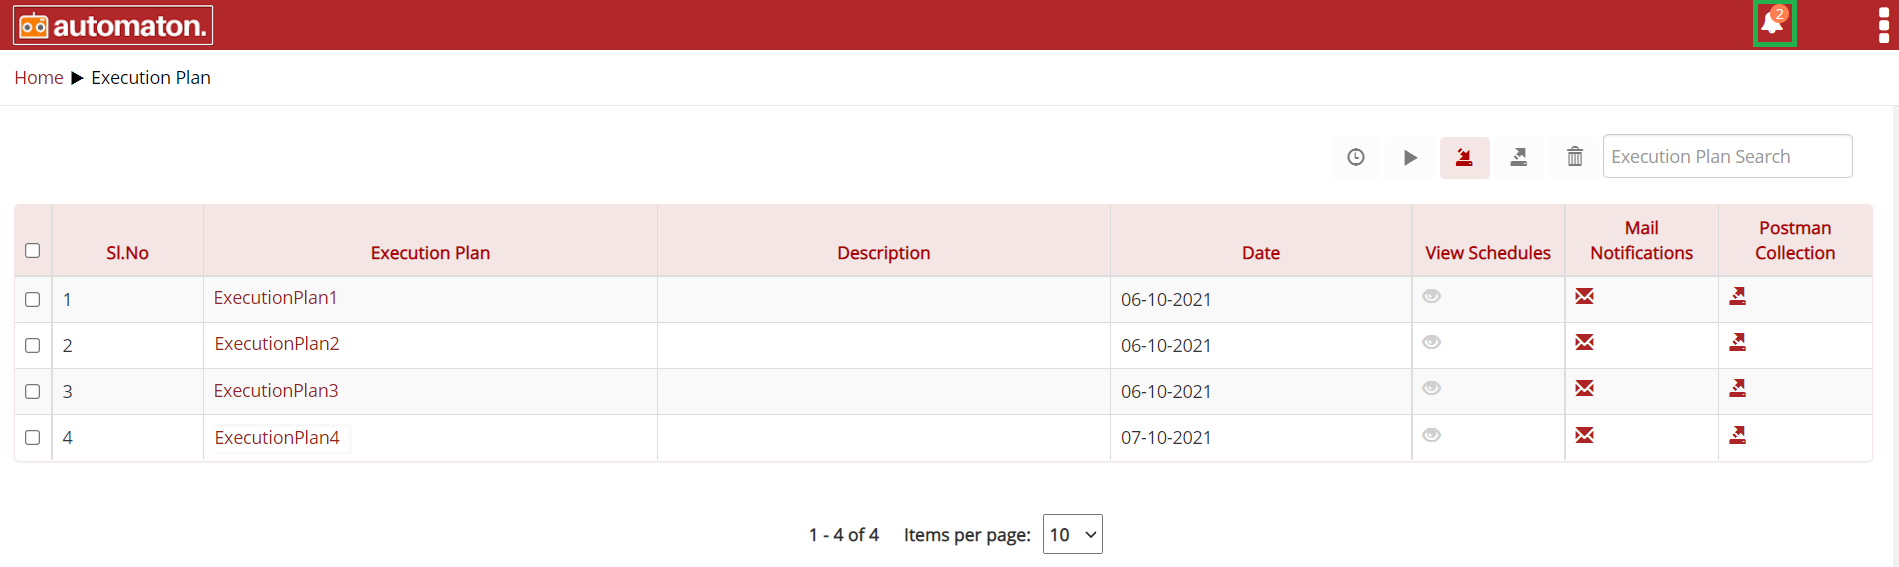
Fig. 4.54 Notification
Click on the notification icon
to display the notification as shown below:
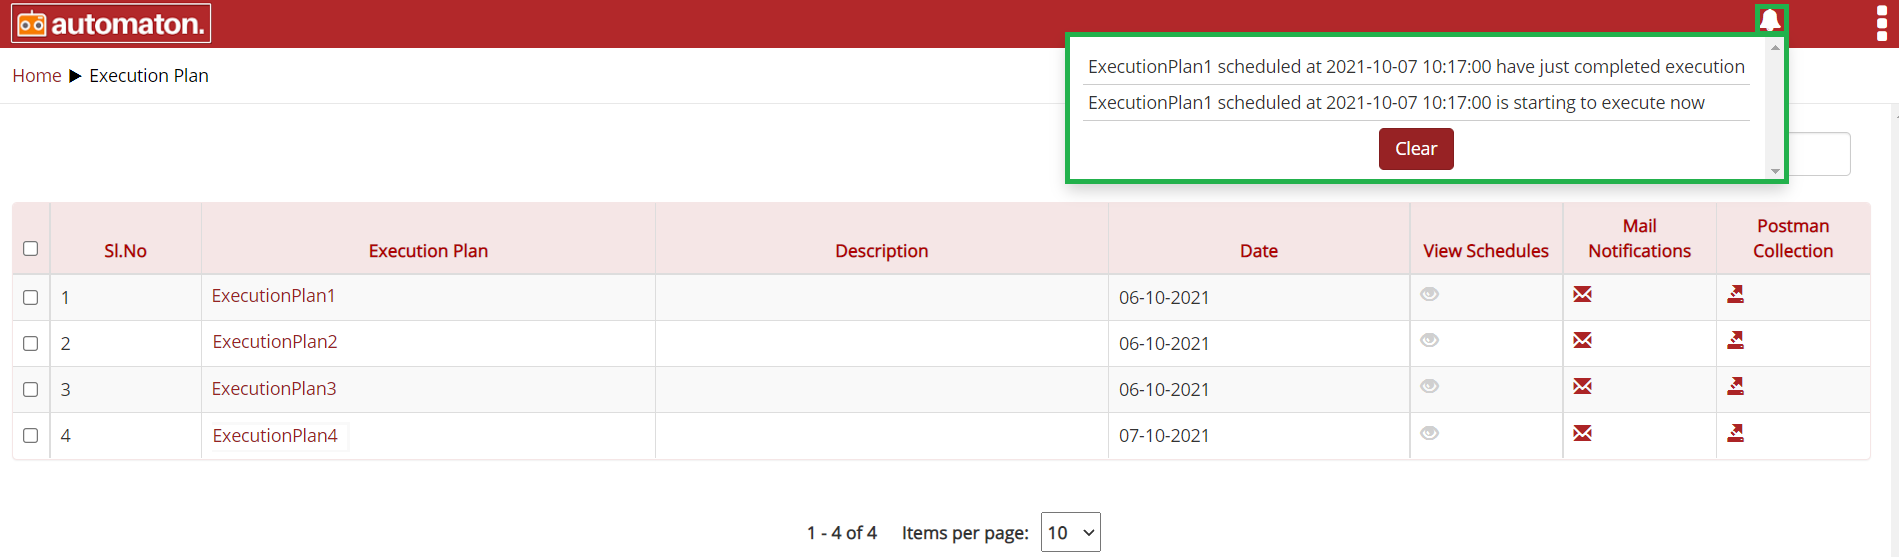
Fig. 4.55 New Notifications
If the users schedule multiple executions, the notification for each execution will be displayed in the notification icon. Click on the notification icon to see the details as shown below:
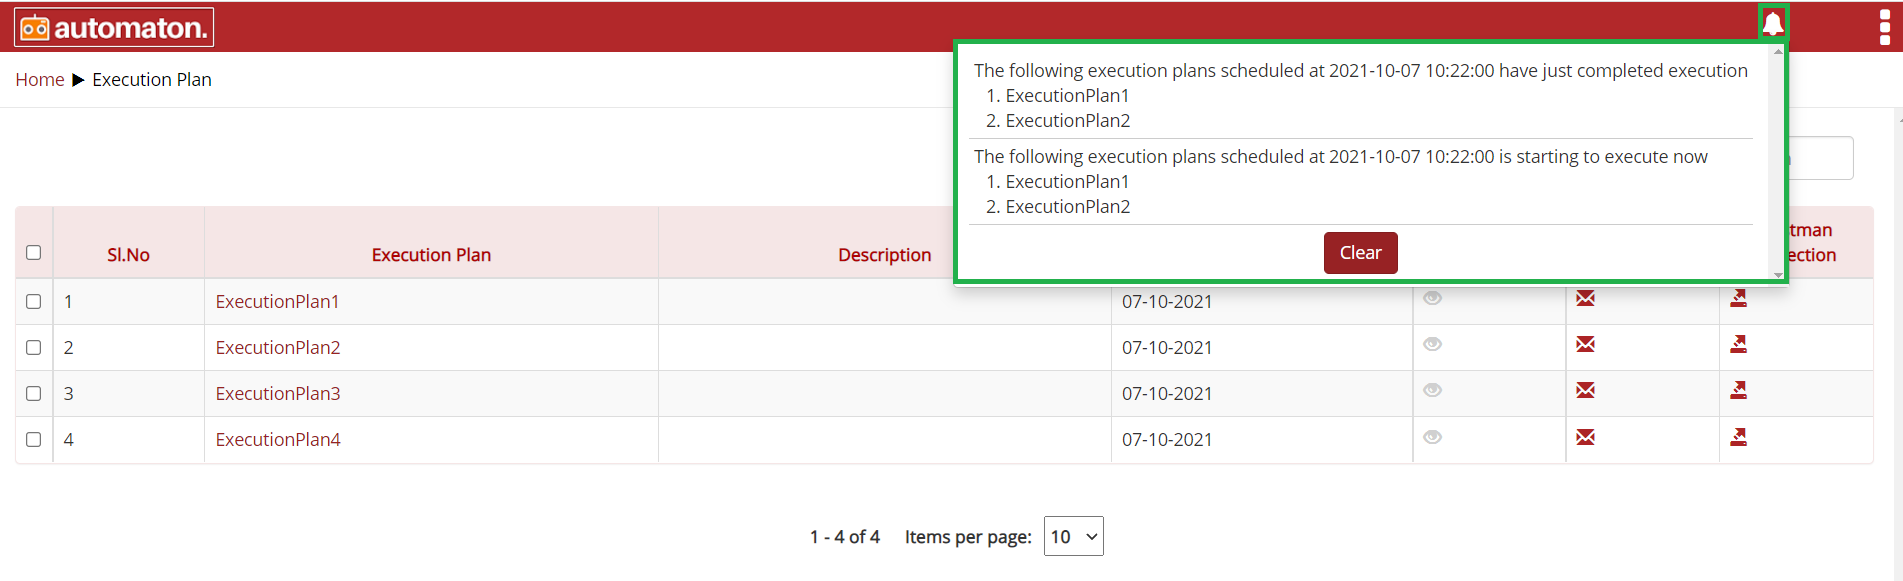
Fig. 4.56 Multiple Execution Notifications
Click the Clear button to clear the notifications as shown below:
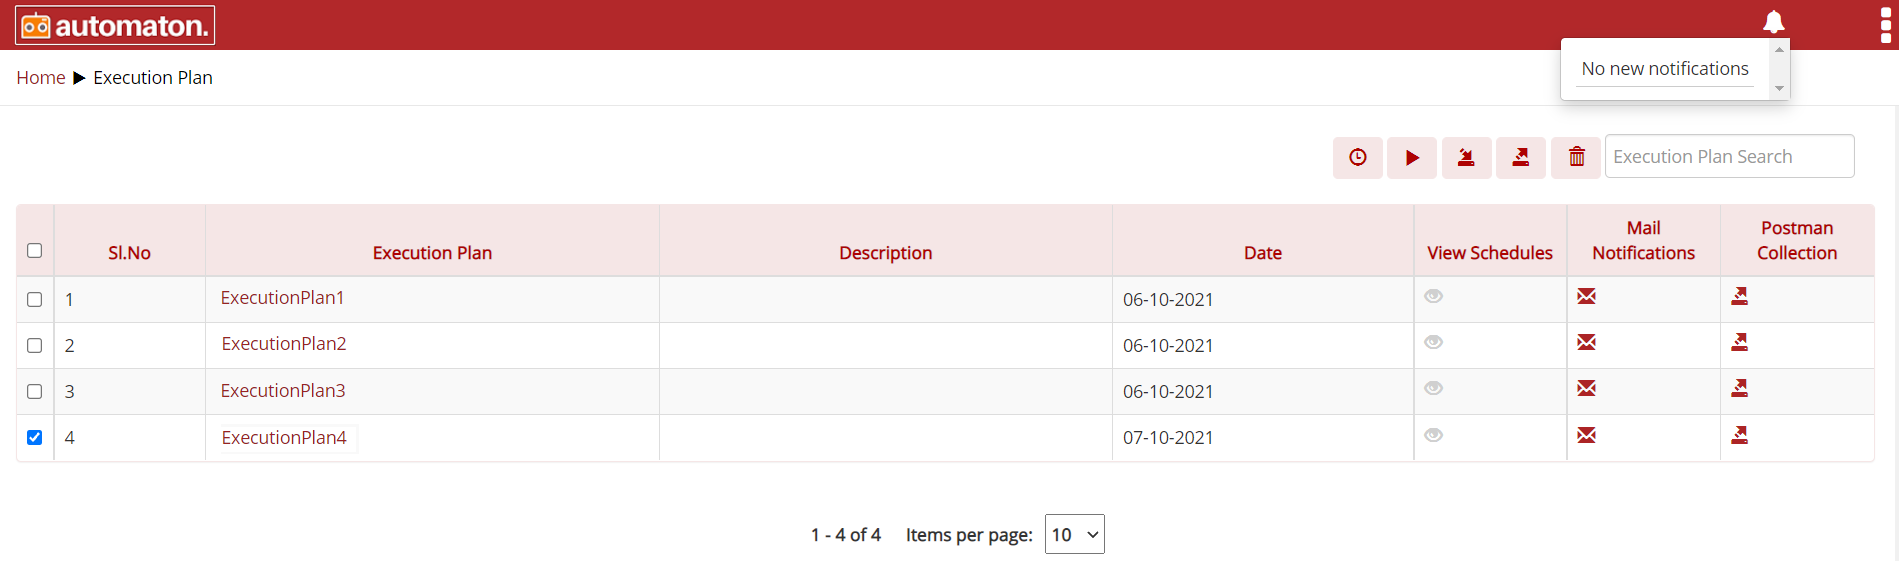
Fig. 4.57 No Notifications
Automaton also supports the execution plan to run parallelly. The steps for parallel execution is as shown below:
- Select anyone of the required execution plan and set the time.
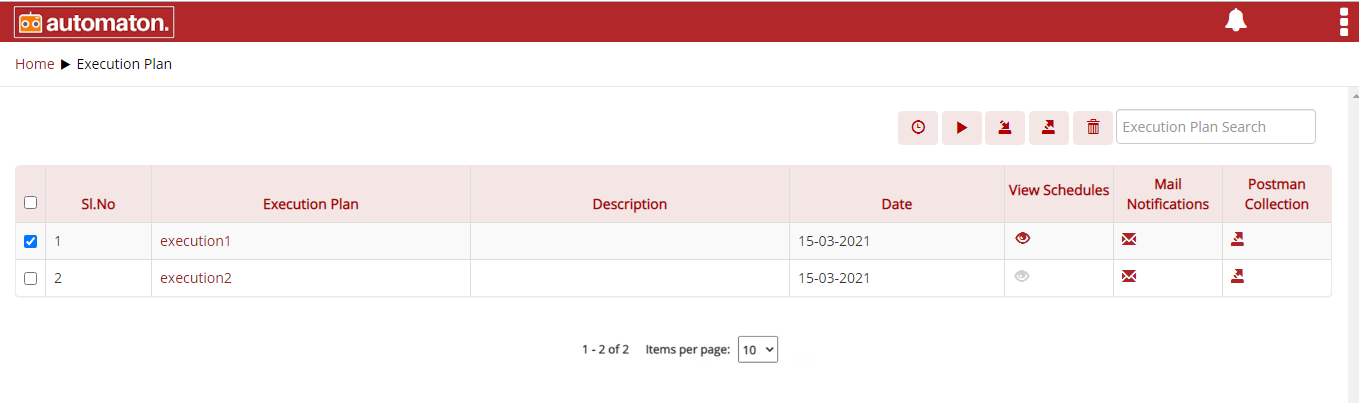
Fig. 4.58 Execution Plan
- Click the scheduler icon, the Execution Plan Scheduler dialog will be displayed as shown below:
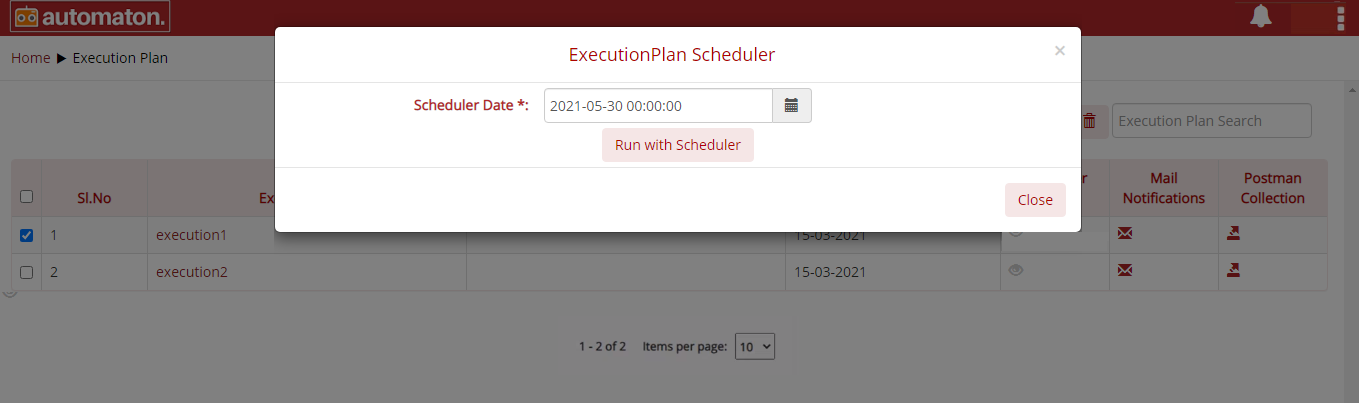
Fig. 4.59 Execution Plan Scheduler
The user must provide the date and time and click the Run with Scheduler button.
- Select the next execution plan and set the same time as the first one and click the Run with Scheduler button.
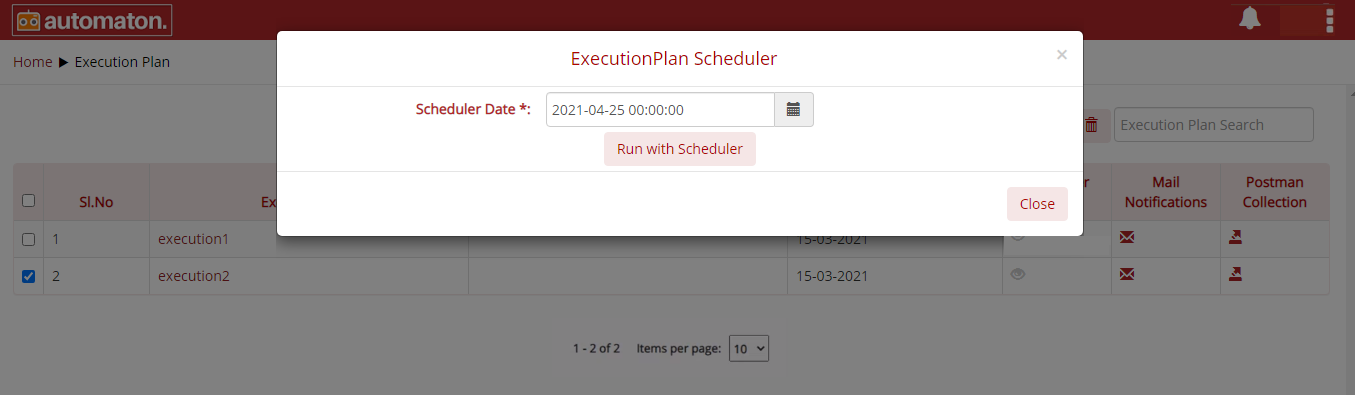
Fig. 4.60 Execution Plan Scheduler
- Click the report icon
on the Test Suite page for a quick view of the report also user can view the detailed report with execution details by clicking the report icon from the homepage as shown below:
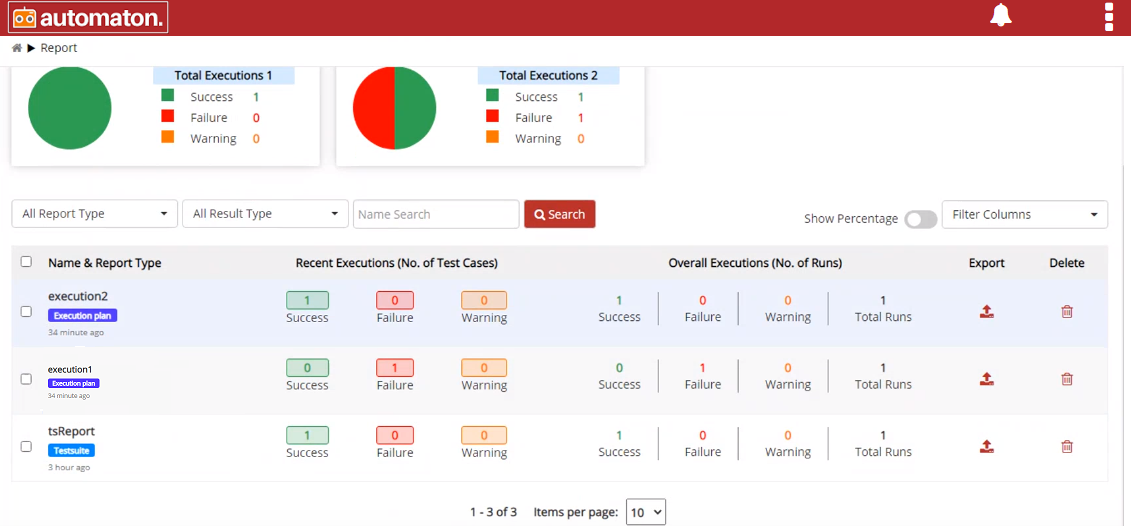
Fig. 4.61 Report Page
Run
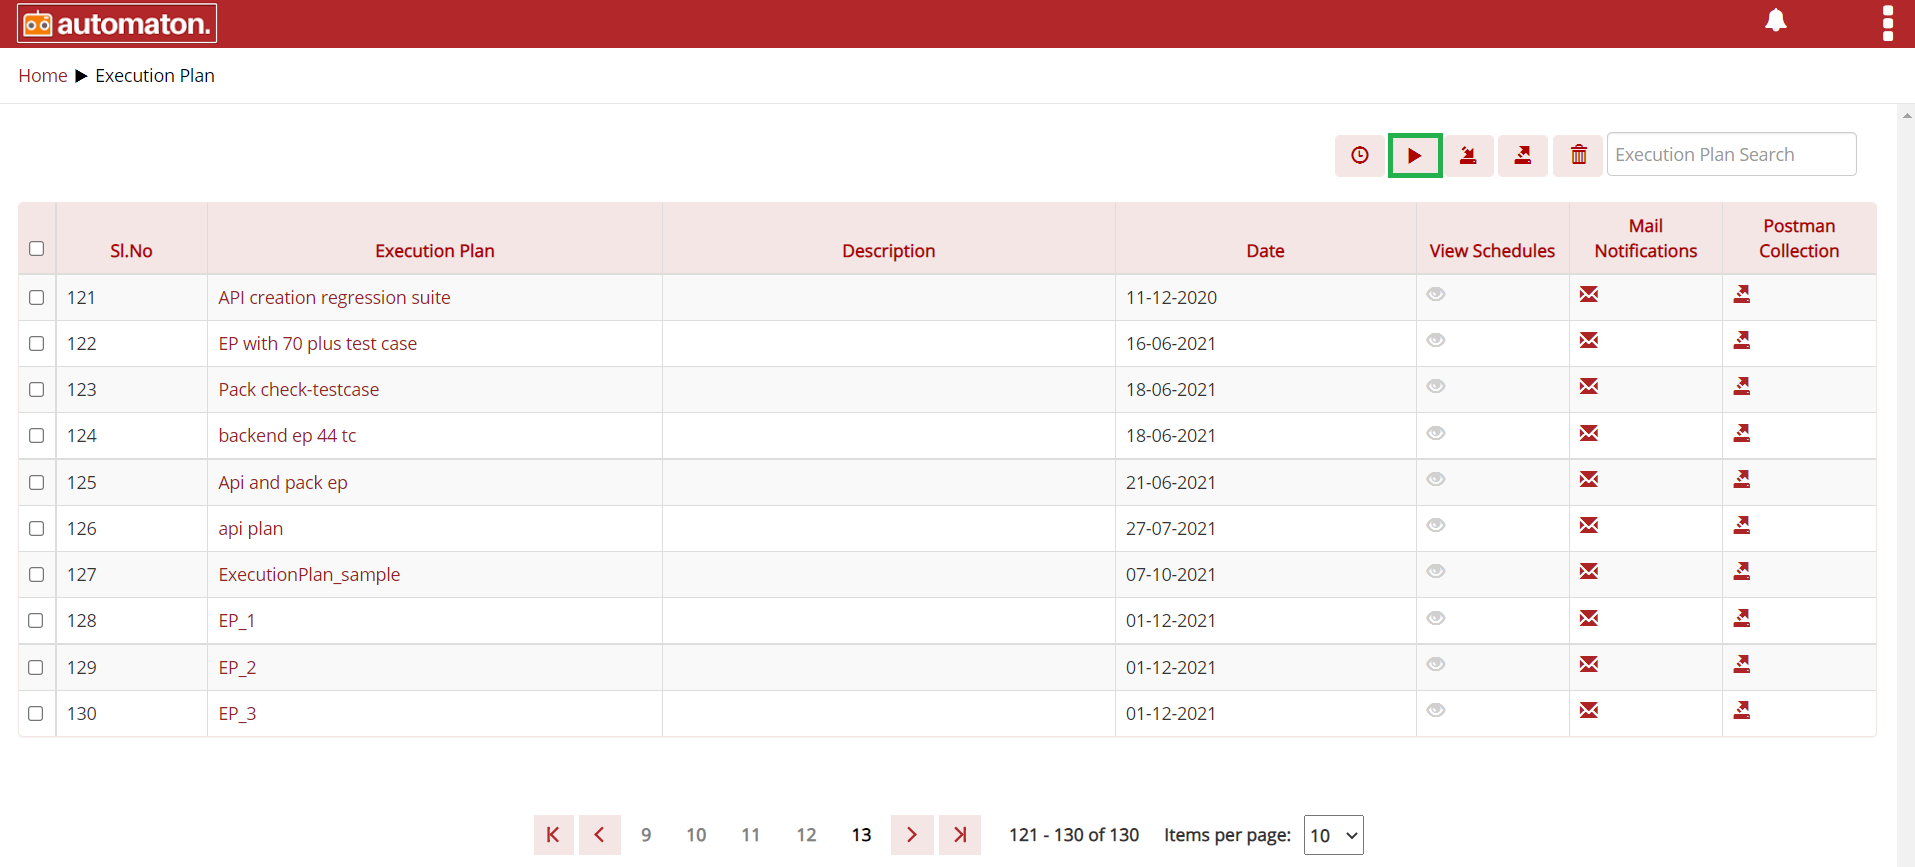
Fig. 4.62 Run
Note
Users can select the order of execution by selecting the checkbox and the test case will be executed in the same order in which it is selected.
Here, users have selected the execution order of the test cases as 128,130,129 as shown below:
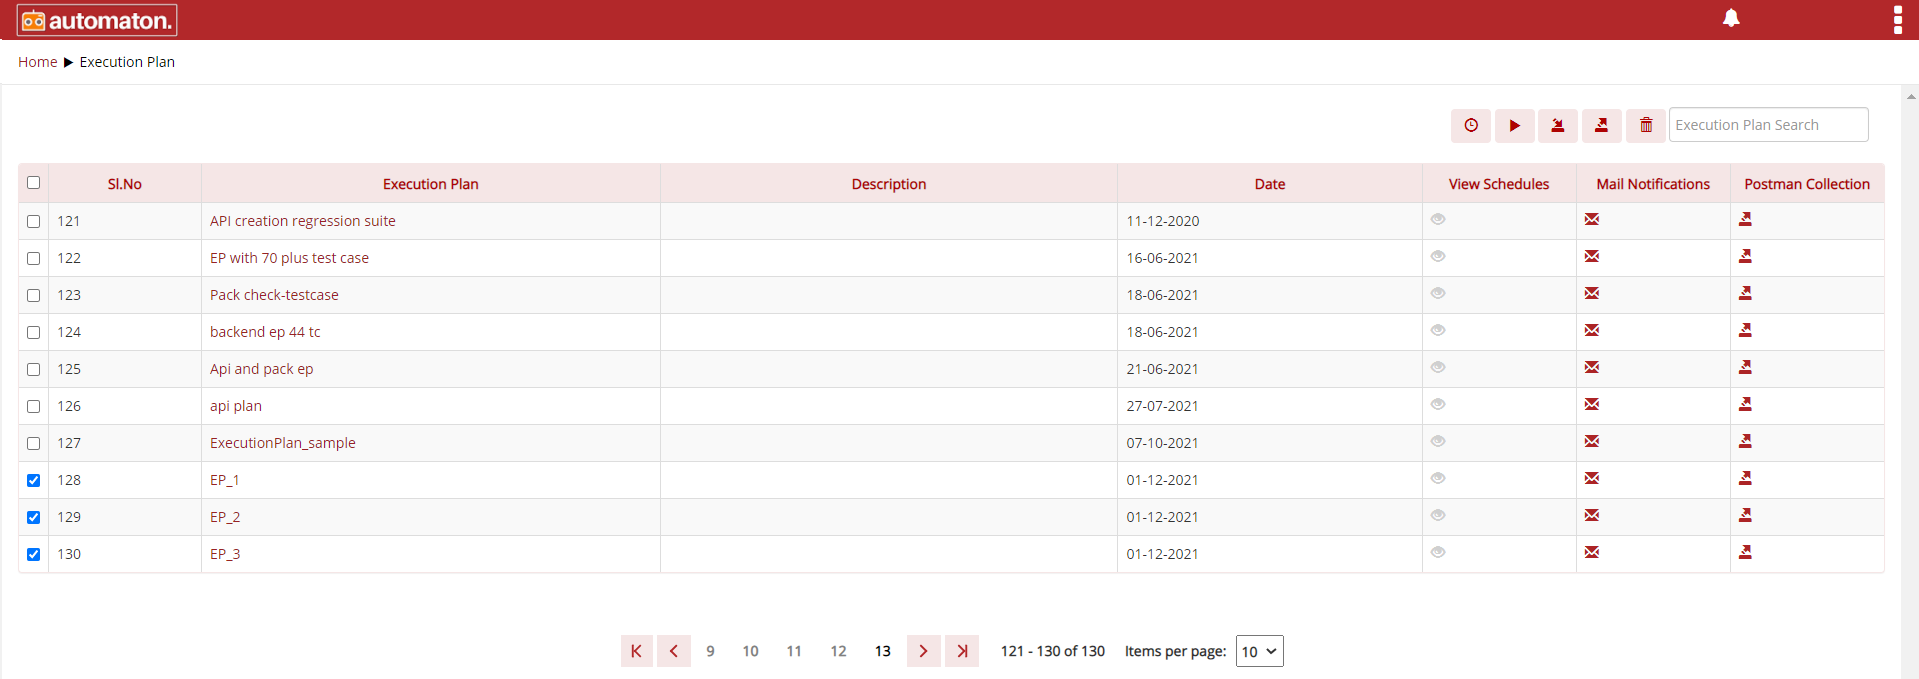
Fig. 4.63 Execution Order
When the user runs the execution plan it will execute in the selected execution order and users can visualize on the report page as shown below:
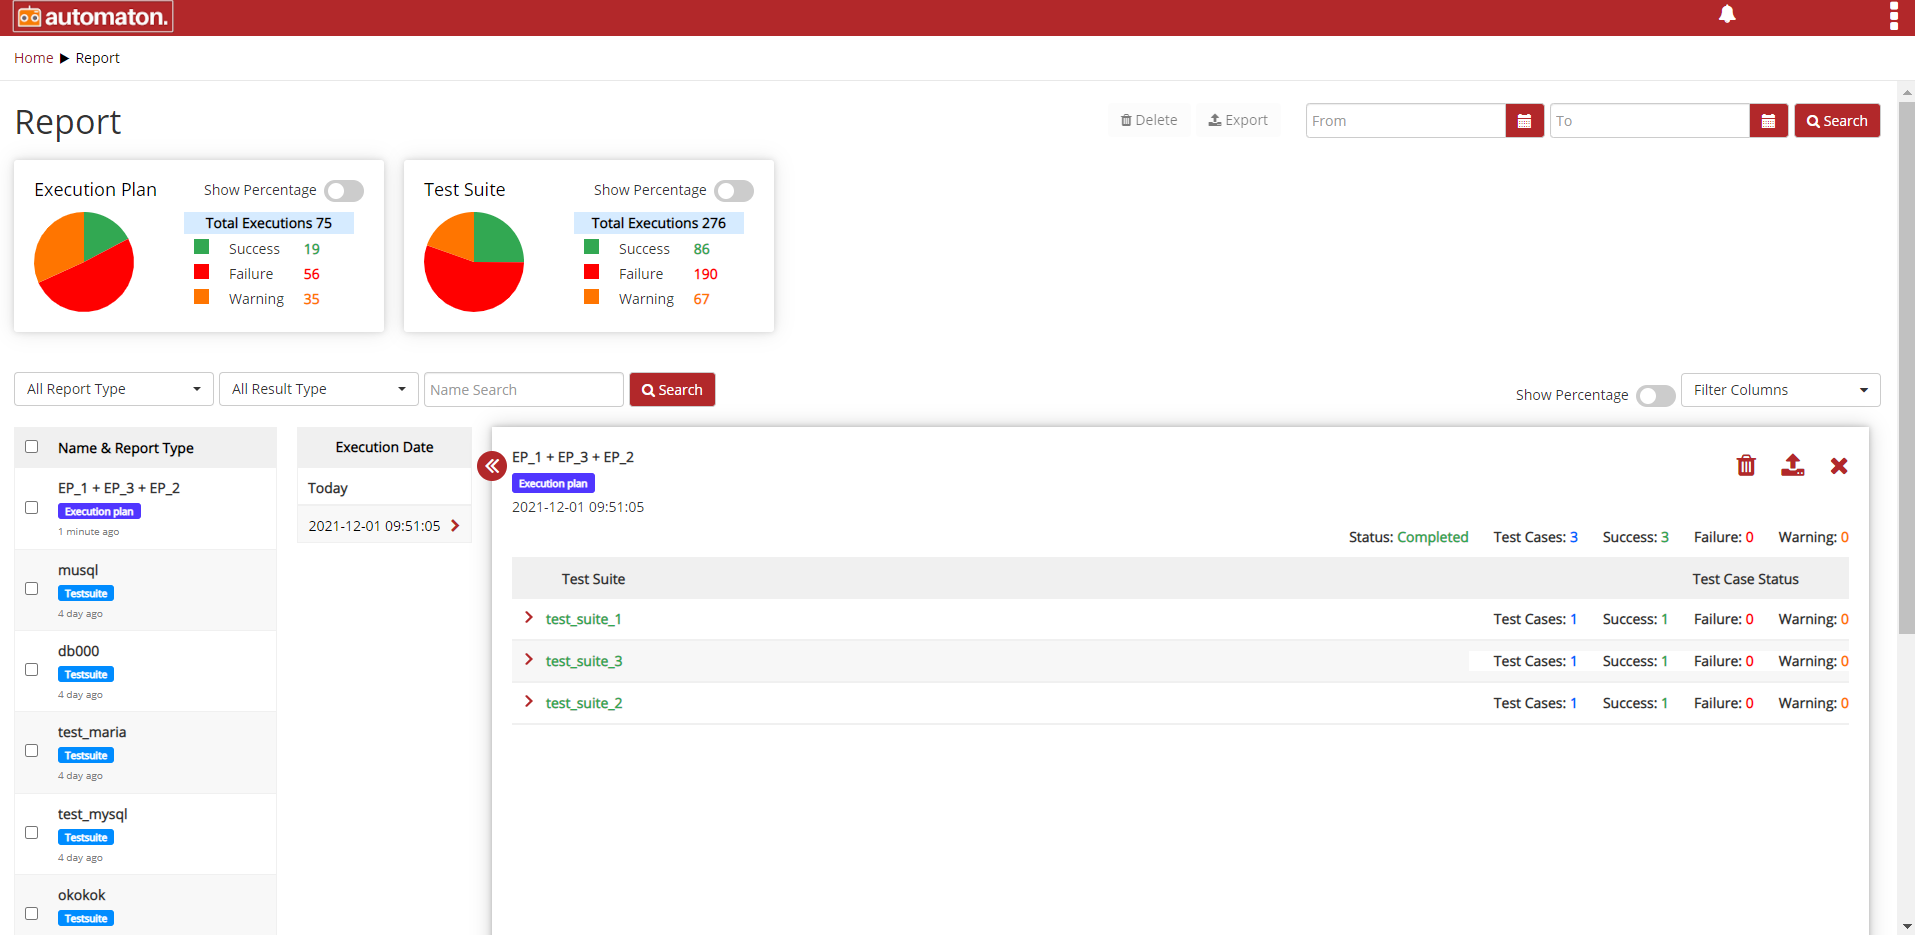
Fig. 4.64 Execution Order Report Page
User can Import, Export and Run execution plan if required.
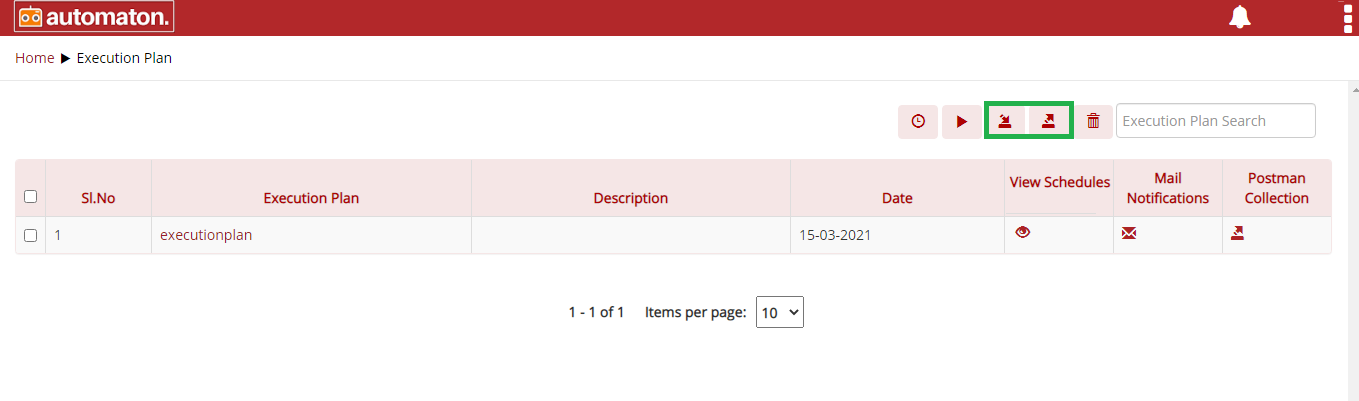
Fig. 4.65 Export/Import
The Execution plan helps to execute test suites or test cases in order. The Execution plan list page has two features like Mail Notifications and Postman Collection.
Mail Notification
This feature helps the user to get a mail notification with the execution plan and its report page. To perform the mail notification first user must configure their mail on the Configure page. Click the Configure from the home page it will navigate to the configure page as shown below:
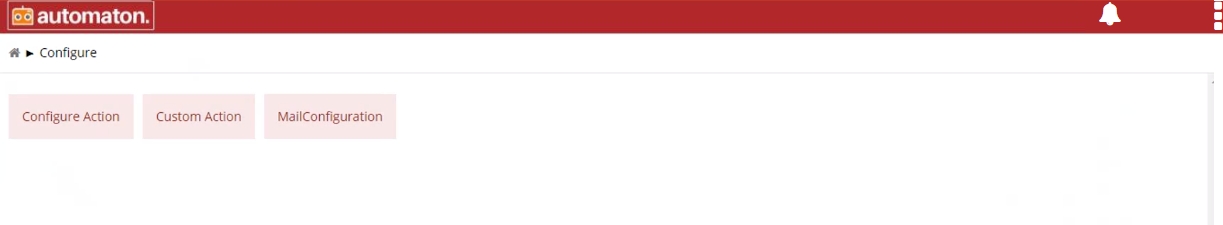
Fig. 4.66 Configure Page
Click the MailConfiguration button, Configure SMTP dialog will be displayed as shown below:
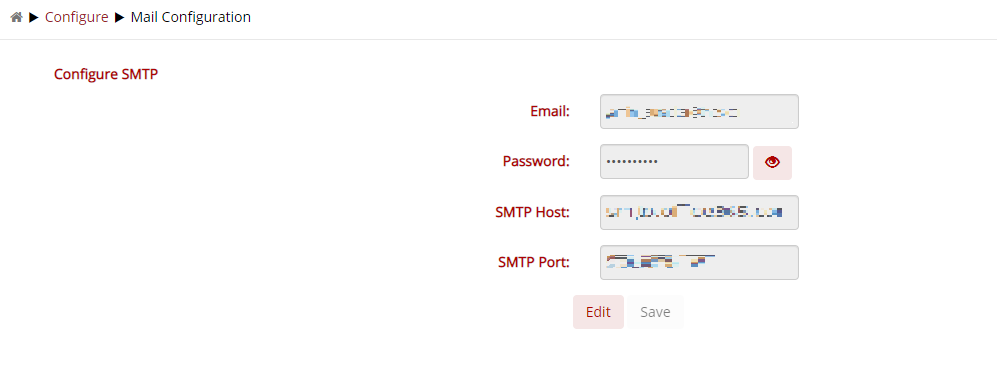
Fig. 4.67 Configure SMTP
Here the user must provide all the details and click the Save button. This page also offers the flexibility to edit the details by clicking the Edit button.
Note
To perform this users must have access to perform the mail configuration.
Once the above configurations are done, click the Execution from the home page it will navigate to the Execution plan page. Click the mail icon
the Send mail notification dialog will be displayed as shown below:
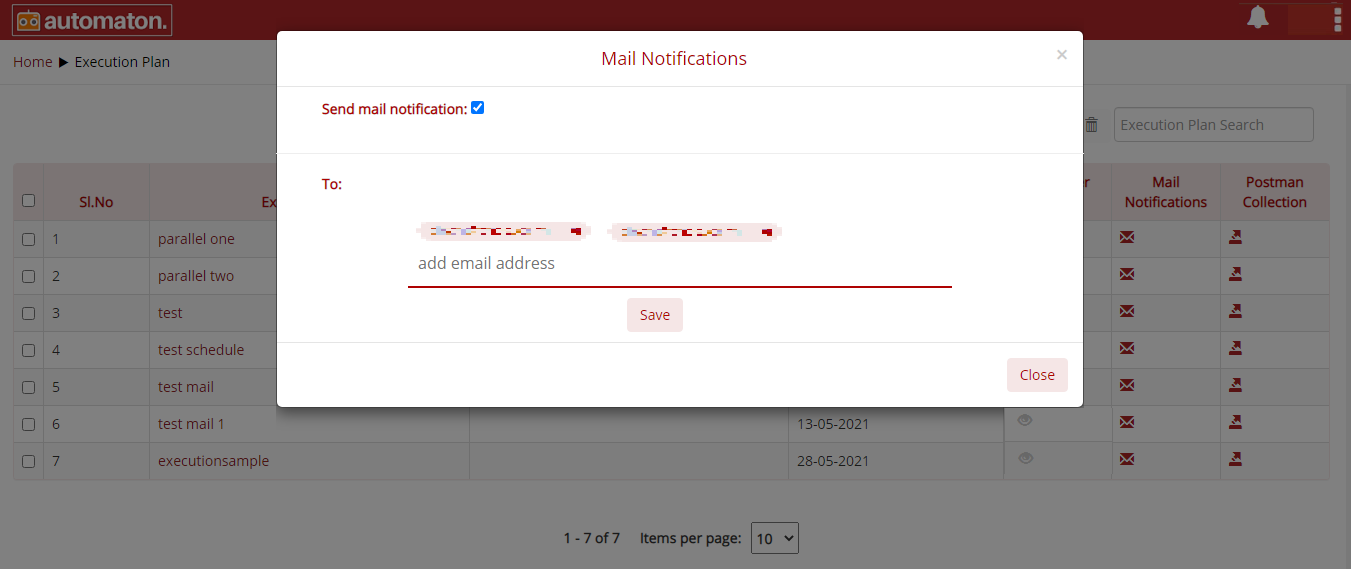
Fig. 4.68 Send Mail Notification
On the above dialog, users must check the Send mail notification to receive the notifications and enter the mail address in the To to whom the execution report page must be sent and click Save and Close. Once the above configuration is done, the address mentioned in the ‘To’ field will be receiving the mail notification of the report page in the execution plan.
Postman Collection
Automaton provides a feature of exporting the json file which contains execution plan details and can import it in postman. This will be saved as a collection so that users can execute this API for further details. Postman collections contain groups of saved requests along with the header and corresponding parameters.
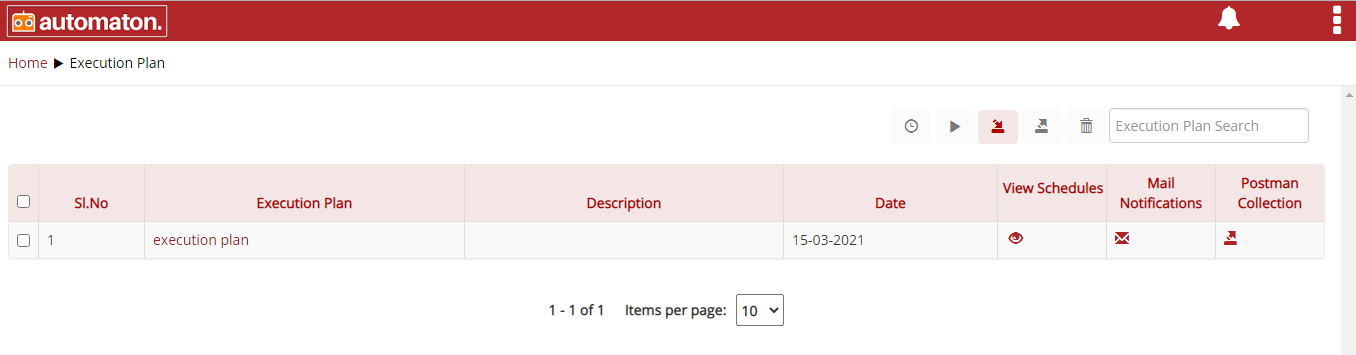
Fig. 4.69 PostMan Collection Execution Plan
Click the postman collection icon
, a json file will be created and downloaded automatically, which contains all execution plan details as shown below:
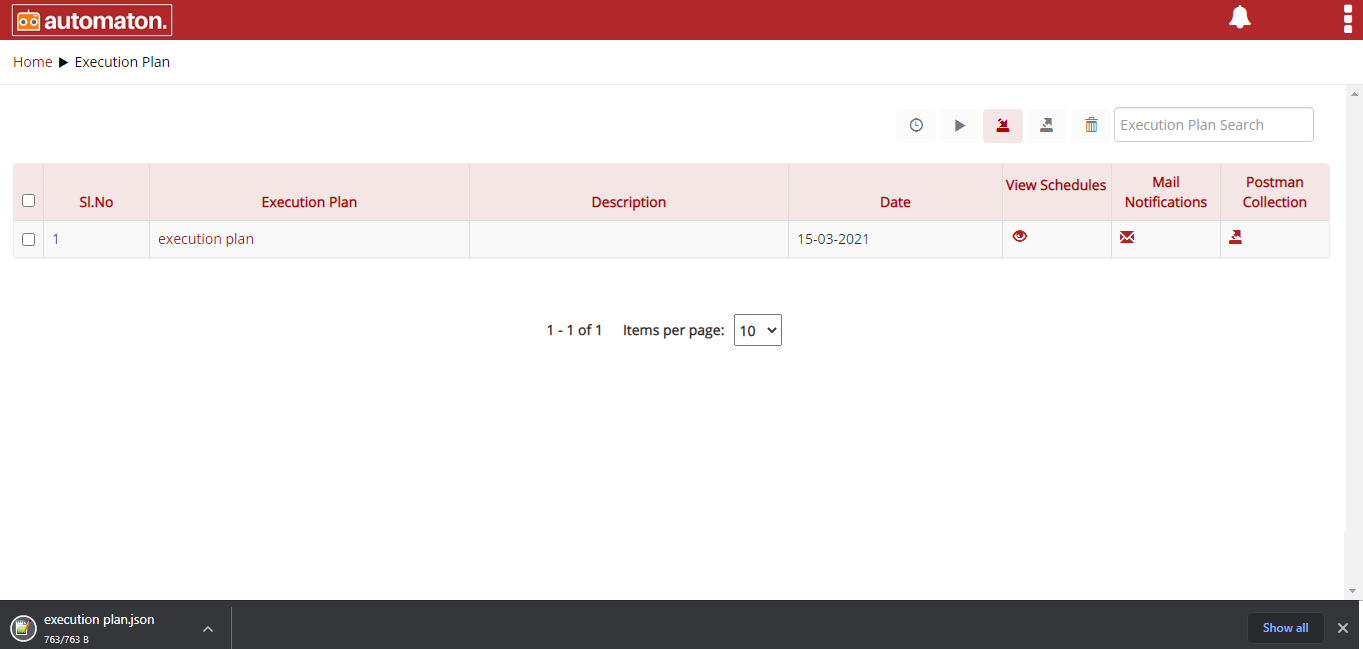
Fig. 4.70 Json Downloaded
The downloaded json file contains the method like, PUT, POST, DELETE. It also contains headers that have a key and its corresponding values, HTTP request, URL along with parameters. If the method is POST or PUT, the request body will also be present in the file.
This json can be imported in postman using File>Import. It will save as a collection in postman which contains the number of saved requests.
The success response after clicking the Send button is as shown below:
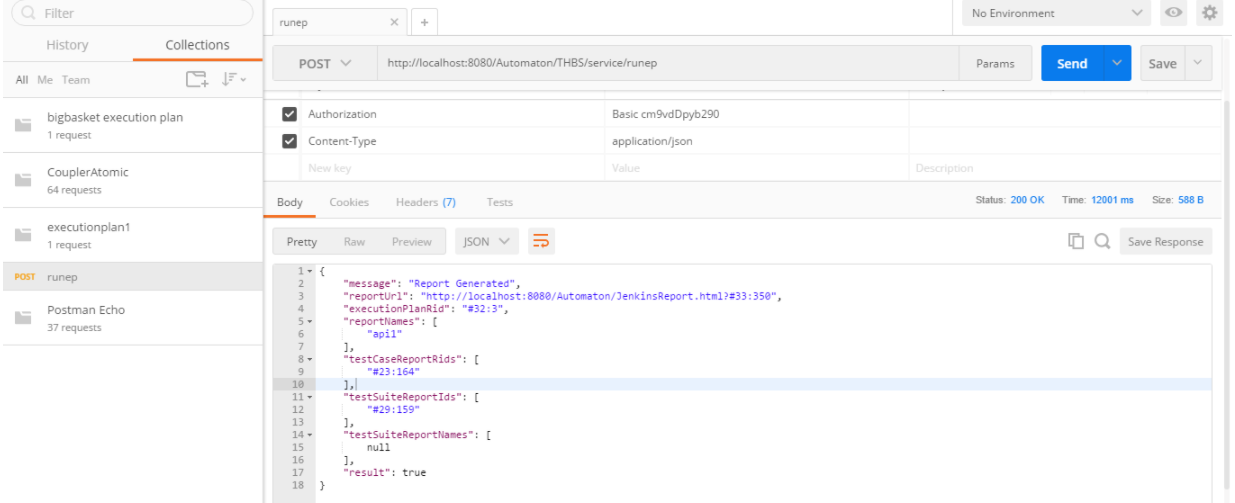
Fig. 4.71 Success Response
Delete Execution Plan
Click the delete icon on the Execution Plan page to delete an execution plan.
The Delete Execution Plan dialog will be displayed. Click the Delete button to soft delete the execution plan or restore from Trash.
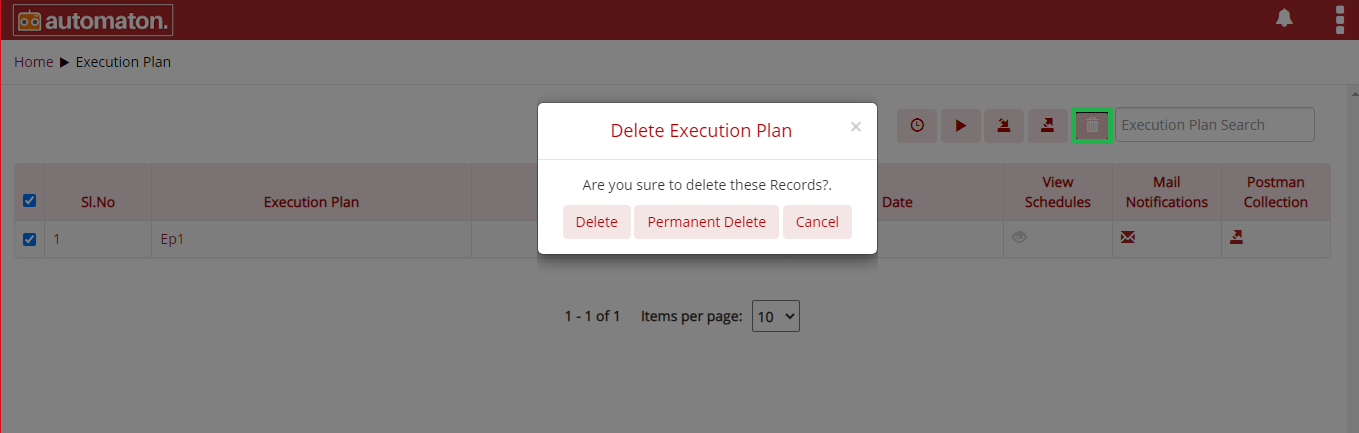
Fig. 4.72 Delete Execution Plan
Permanent Delete Execution Plan
Click the Permanent Delete button to delete permanently or click Cancel to exit. The items clicked by permanent delete cannot be restored from the trash page.
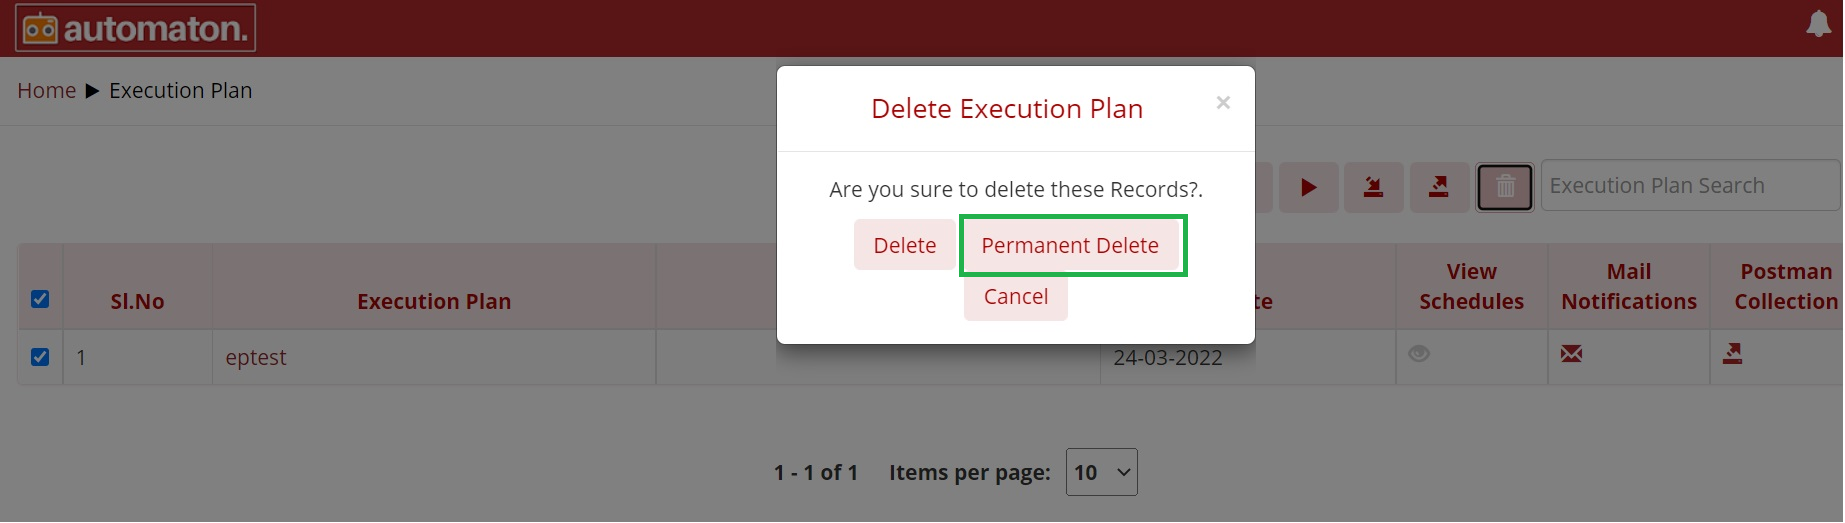
Fig. 4.73 Permanent Delete Execution Plan
4.6. Help
Fig. 4.74 Help
Click the Help tile will navigate to documentation where the user can learn all the features in detail and understand how to do.
Fig. 4.75 Automaton Documentation
4.7. Trash
Click the Trash tile will navigate to the Trash page where the user can view all the soft-deleted Test Suite, Test Case, Execution Plan, Custom Action in the respective tile as shown below:
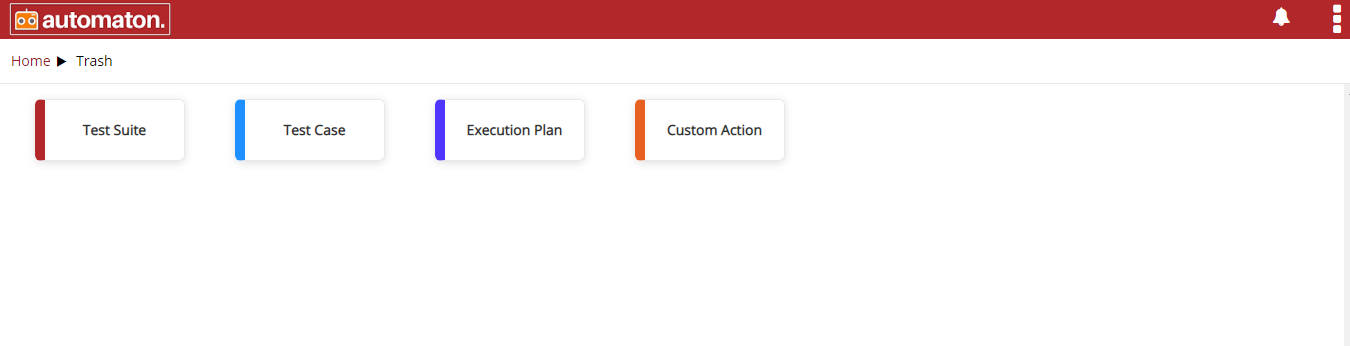
Fig. 4.76 Trash Page
For example, If the user deletes a test suite it will display in TestSuite column as shown below:
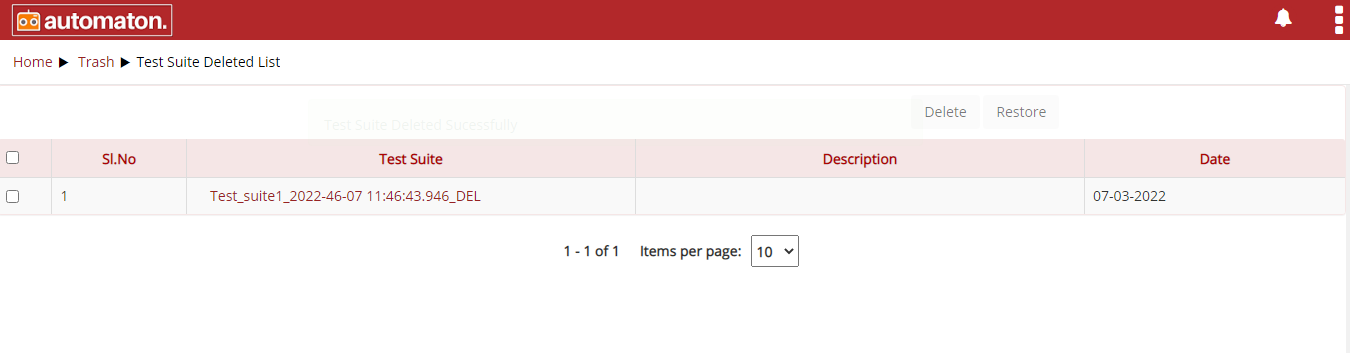
Fig. 4.77 Deleted Test Suite
Here users can select delete or restore multiple testsuites by selecting the appropriate checkbox. Click the Delete button to permanently delete the test suite and click the Restore button to restore the testsuite. Steps for restoring the test suites are:
- Select the test suite to be restored.
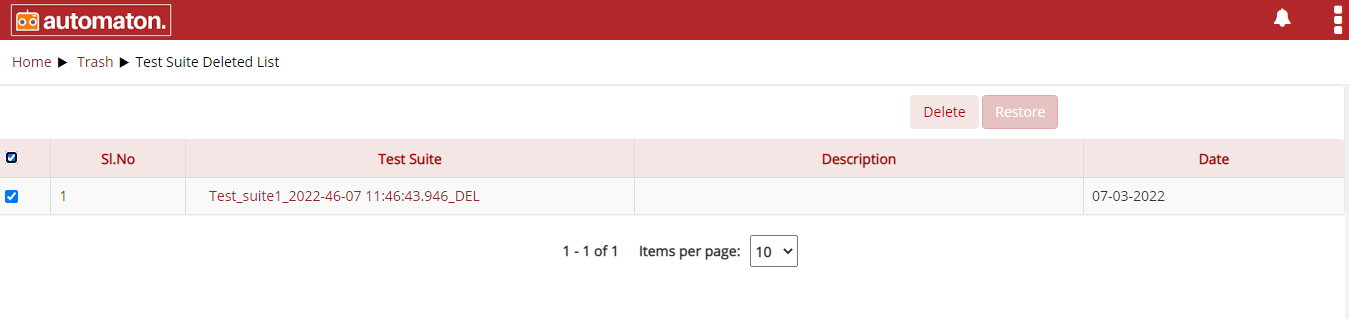
Fig. 4.78 Selected Test Suite
- Click the restore button and a success message will be displayed.
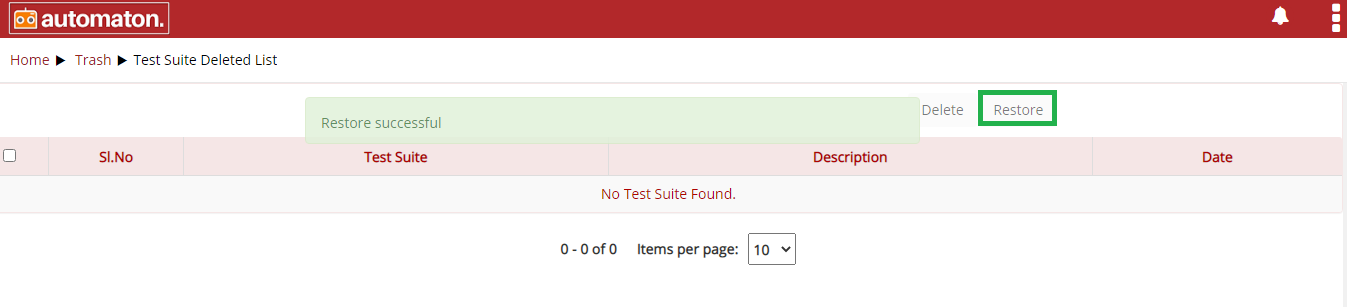
Fig. 4.79 Restore Test Suite
- It will be added on the testsuite page as shown below:
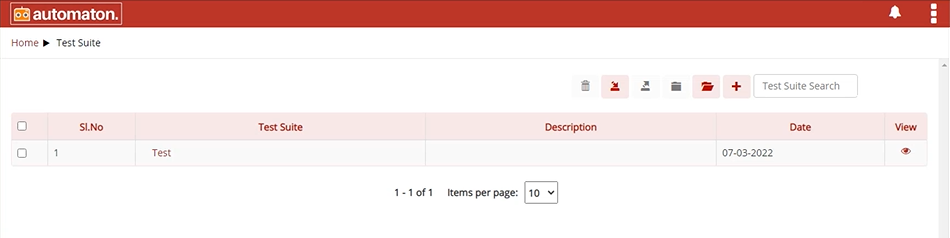
Fig. 4.80 Restored Test Suite
The same steps to be followed to delete permanently the test case, execution plan and custom action.